Washington Post 2013 Annual Report Download - page 91
Download and view the complete annual report
Please find page 91 of the 2013 Washington Post annual report below. You can navigate through the pages in the report by either clicking on the pages listed below, or by using the keyword search tool below to find specific information within the annual report.-
 1
1 -
2
-
3
-
4
-
5
-
6
-
7
-
8
-
9
-
10
-
11
-
12
-
13
-
14
-
15
-
16
-
17
-
18
-
19
-
20
-
21
-
22
-
23
-
24
-
25
-
26
-
27
-
28
-
29
-
30
-
31
-
32
-
33
-
34
-
35
-
36
-
37
-
38
-
39
-
40
-
41
-
42
-
43
-
44
-
45
-
46
-
47
-
48
-
49
-
50
-
51
-
52
-
53
-
54
-
55
-
56
-
57
-
58
-
59
-
60
-
61
-
62
-
63
-
64
-
65
-
66
-
67
-
68
-
69
-
70
-
71
-
72
-
73
-
74
-
75
-
76
-
77
-
78
-
79
-
80
-
 81
81 -
 82
82 -
 83
83 -
 84
84 -
 85
85 -
 86
86 -
 87
87 -
 88
88 -
 89
89 -
 90
90 -
 91
91 -
 92
92 -
 93
93 -
 94
94 -
 95
95 -
 96
96 -
 97
97 -
 98
98 -
 99
99 -
 100
100 -
 101
101 -
102
-
103
-
104
-
105
-
106
-
107
-
108
-
109
-
110
-
111
-
112
 |
 |

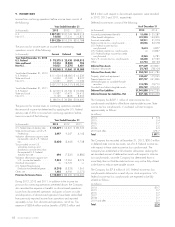
the Company’s stock was $663.32 at December 31, 2013. At
December 31, 2013, there were 48,500 unvested options
related to this plan with an average exercise price of $442.02
and a weighted average remaining contractual term of 7.9 years.
At December 31, 2012, there were 61,673 unvested options
with an average exercise price of $460.24.
As of December 31, 2013, total unrecognized stock-based
compensation expense related to stock options was $3.4 million,
which is expected to be recognized on a straight-line basis over a
weighted average period of approximately 1.9 years. There were
14,500 options exercised during 2013. The total intrinsic value of
options exercised during 2013 was $3.2 million; a tax benefit from
these stock option exercises of $1.3 million was realized. No
options were exercised during 2012 and 2011.
All options granted during 2013 and 2012 were at an exercise
price equal to the fair market value of the Company’s common stock
at the date of grant. During 2011, the Company granted 50,000
options at an exercise price above the fair market value of its
common stock at the date of grant. All other options granted during
2011 were at an exercise price equal to the fair market value of the
Company’s common stock at the date of grant. The weighted
average grant-date fair value of options granted during 2013, 2012
and 2011 was $91.74, $91.71 and $110.67, respectively. Also,
in early 2014, an additional 5,000 stock options were granted.
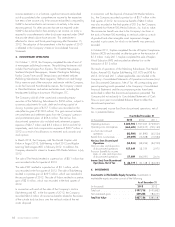
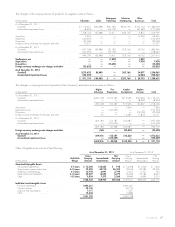
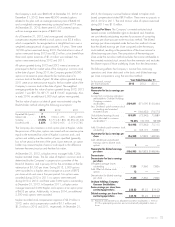
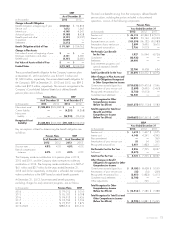
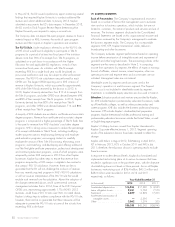
The fair value of options at date of grant was estimated using the
Black-Scholes method utilizing the following assumptions:
2013 2012 2011
Expected life (years) . 777
Interest rate ....... 1.31% 1.04%–1.27% 1.49%–2.85%
Volatility ......... 31.80% 31.71%–31.80% 30.35%–31.24%
Dividend yield ..... 2.63% 2.54%–2.60% 2.11%–2.74%
The Company also maintains a stock option plan at Kaplan. Under
the provisions of this plan, options are issued with an exercise price
equal to the estimated fair value of Kaplan’s common stock, and
options vest ratably over the number of years specified (generally
four to five years) at the time of the grant. Upon exercise, an option
holder may receive Kaplan shares or cash equal to the difference
between the exercise price and the then fair value.
At December 31, 2013, a Kaplan senior manager holds 7,206
Kaplan restricted shares. The fair value of Kaplan’s common stock is
determined by the Company’s compensation committee of the
Board of Directors, and in January 2014, the committee set the fair
value price at $1,150 per share. During 2013, 5,000 options
were awarded to a Kaplan senior manager at a price of $973
per share which vest over a four-year period. No options were
awarded during 2012 or 2011; no options were exercised
during 2013 or 2012; and there were 5,000 options outstanding
at December 31, 2013. In December 2011, a Kaplan senior
manager exercised 2,000 Kaplan stock options at an option price
of $652 per option. Additionally, in January 2014, an additional
2,500 stock options were awarded.
Kaplan recorded stock compensation expense of $2.9 million in
2013, and a stock compensation credit of $1.1 million and
$1.3 million in 2012 and 2011, respectively. At December 31,
2013, the Company’s accrual balance related to Kaplan stock-
based compensation totaled $9.9 million. There were no payouts in
2013, 2012 or 2011. The total intrinsic value of options exercised
during 2011 was $1.0 million.
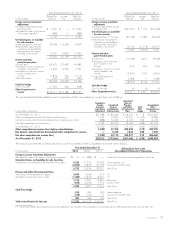
Earnings Per Share. The Company’s unvested restricted stock
awards contain nonforfeitable rights to dividends and, therefore,
are considered participating securities for purposes of computing
earnings per share pursuant to the two-class method. The diluted
earnings per share computed under the two-class method is lower
than the diluted earnings per share computed under the treasury
stock method, resulting in the presentation of the lower amount in
diluted earnings per share. The computation of the earnings per
shareunderthetwo-classmethodexcludestheincomeattributableto
the unvested restricted stock awards from the numerator and excludes
the dilutive impact of those underlying shares from the denominator.
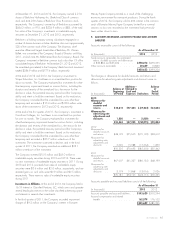
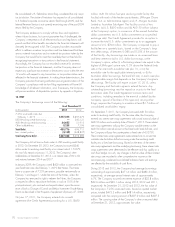
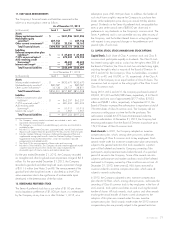
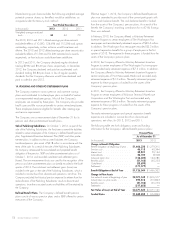
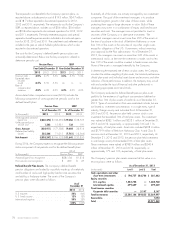
The following reflects the Company’s income from continuing
operations and share data used in the basic and diluted earnings
per share computations using the two-class method:
(in thousands, except
per share amounts)
Year Ended December 31
2013 2012 2011
Numerator:
Numerator for basic earnings per
share
Income from continuing operations
attributable to Graham Holdings
Company common
stockholders ................ $189,891 $71,090 $150,464
Less: Dividends paid–common stock
outstanding and unvested
restricted shares ............. —(146,432) (74,575)
Undistributed earnings (losses) .... 189,891 (75,342) 75,889
Percent allocated to common
stockholders(1) .............. 98.45% 100.00% 98.98%
186,948 (75,342) 75,115
Add: Dividends paid–common stock
outstanding ................ —143,175 73,831
Numerator for basic earnings per
share .................... 186,948 67,833 148,946
Add: Additional undistributed
earnings due to dilutive stock
options ................... 5——
Numerator for diluted earnings
per share ................. $186,953 $67,833 $148,946
Denominator:
Denominator for basic earnings
per share
Weighted average shares
outstanding ................ 7,238 7,360 7,826
Add: Effect of dilutive stock
options ................... 12 ——
Denominator for diluted earnings
per share .................. 7,250 7,360 7,826
Graham Holdings Company
Common Stockholders:
Basic earnings per share from
continuing operations ........ $25.83 $9.22 $19.03
Diluted earnings per share from
continuing operations ........ $25.78 $9.22 $19.03
(1) Percent of undistributed losses allocated to common stockholders is 100% in
2012 as participating securities are not contractually obligated to share in
losses.
2013 FORM 10-K 73