Washington Post 2013 Annual Report Download - page 102
Download and view the complete annual report
Please find page 102 of the 2013 Washington Post annual report below. You can navigate through the pages in the report by either clicking on the pages listed below, or by using the keyword search tool below to find specific information within the annual report.-
 1
1 -
2
-
3
-
4
-
5
-
6
-
7
-
8
-
9
-
10
-
11
-
12
-
13
-
14
-
15
-
16
-
17
-
18
-
19
-
20
-
21
-
22
-
23
-
24
-
25
-
26
-
27
-
28
-
29
-
30
-
31
-
32
-
33
-
34
-
35
-
36
-
37
-
38
-
39
-
40
-
41
-
42
-
43
-
44
-
45
-
46
-
47
-
48
-
49
-
50
-
51
-
52
-
53
-
54
-
55
-
56
-
57
-
58
-
59
-
60
-
61
-
62
-
63
-
64
-
65
-
66
-
67
-
68
-
69
-
70
-
71
-
72
-
73
-
74
-
75
-
76
-
77
-
78
-
79
-
80
-
81
-
82
-
83
-
84
-
85
-
86
-
87
-
88
-
89
-
90
-
91
-
 92
92 -
 93
93 -
 94
94 -
 95
95 -
 96
96 -
 97
97 -
 98
98 -
 99
99 -
 100
100 -
 101
101 -
 102
102 -
 103
103 -
 104
104 -
 105
105 -
 106
106 -
 107
107 -
 108
108 -
 109
109 -
 110
110 -
 111
111 -
 112
112
 |
 |

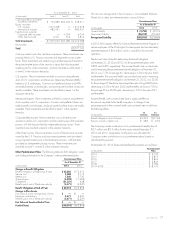
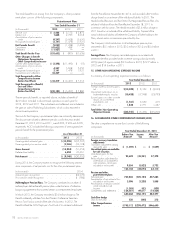
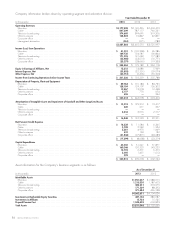
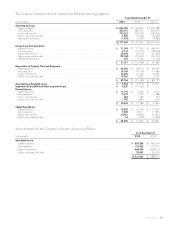
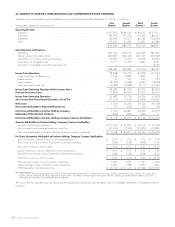
Company information broken down by operating segment and education division:
Year Ended December 31
(in thousands) 2013 2012 2011
Operating Revenues
Education ..................................................................... $2,177,508 $2,196,496 $2,404,459
Cable ....................................................................... 807,309 787,117 760,221
Television broadcasting ........................................................... 374,605 399,691 319,206
Other businesses ............................................................... 128,803 72,837 42,891
Corporate office ................................................................ ———
Intersegment elimination .......................................................... (361) (571) (780)
$3,487,864 $3,455,570 $3,525,997
Income (Loss) from Operations
Education ..................................................................... $ 51,301 $ (105,368) $ 96,286
Cable ....................................................................... 169,735 154,581 156,844
Television broadcasting ........................................................... 171,276 191,642 117,089
Other businesses ............................................................... (23,468) (33,010) (16,771)
Corporate office ................................................................ (23,279) (28,665) (19,330)
$ 345,565 $ 179,180 $ 334,118
Equity in Earnings of Affiliates, Net ................................................... 13,215 14,086 5,949
Interest Expense, Net ............................................................. (33,803) (32,551) (29,079)
Other Expense, Net ............................................................... (23,751) (5,456) (55,200)
Income from Continuing Operations before Income Taxes .................................. $ 301,226 $ 155,259 $ 255,788
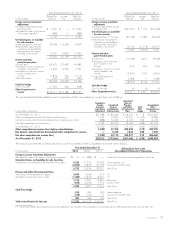
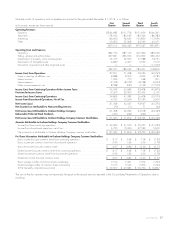
Depreciation of Property, Plant and Equipment
Education ..................................................................... $ 89,764 $ 101,183 $ 83,735
Cable ....................................................................... 128,184 129,107 126,302
Television broadcasting ........................................................... 12,467 13,018 12,448
Other businesses ............................................................... 2,177 770 674
Corporate office ................................................................ 626 —244
$ 233,218 $ 244,078 $ 223,403
Amortization of Intangible Assets and Impairment of Goodwill and Other Long-Lived Assets
Education ..................................................................... $ 13,212 $ 129,312 $ 19,417
Cable ....................................................................... 220 211 267
Television broadcasting ........................................................... ———
Other businesses ............................................................... 3,416 3,016 2,517
Corporate office ................................................................ ———
$ 16,848 $ 132,539 $ 22,201
Net Pension (Credit) Expense
Education ..................................................................... $ 16,538 $ 11,584 $ 6,345
Cable ....................................................................... 3,708 2,540 1,924
Television broadcasting ........................................................... 3,381 4,970 1,669
Other businesses ............................................................... 610 169 132
Corporate office ................................................................ (41,836) (27,871) (33,289)
$ (17,599) $ (8,608) $ (23,219)
Capital Expenditures
Education ..................................................................... $ 45,550 $ 51,241 $ 51,871
Cable ....................................................................... 160,246 150,525 143,225
Television broadcasting ........................................................... 12,702 6,401 6,415
Other businesses ............................................................... 2,005 1,451 1,013
Corporate office ................................................................ 309 ——
$ 220,812 $ 209,618 $ 202,524
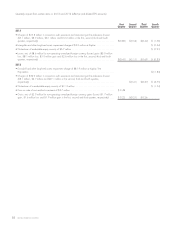
Asset information for the Company’s business segments is as follows:
As of December 31
(in thousands) 2013 2012
Identifiable Assets
Education ................................................................................. $1,921,037 $1,988,015
Cable .................................................................................... 1,215,320 1,187,603
Television broadcasting ....................................................................... 383,251 374,075
Other businesses ............................................................................ 171,539 88,393
Corporate office ............................................................................. 371,484 466,538
$4,062,631 $4,104,624
Investments in Marketable Equity Securities ......................................................... 487,156 380,087
Investments in Affiliates ........................................................................ 15,754 15,535
Prepaid Pension Cost .......................................................................... 1,245,505 604,823
Total Assets ................................................................................. $5,811,046 $5,105,069
84 GRAHAM HOLDINGS COMPANY