Washington Post 2013 Annual Report Download - page 58
Download and view the complete annual report
Please find page 58 of the 2013 Washington Post annual report below. You can navigate through the pages in the report by either clicking on the pages listed below, or by using the keyword search tool below to find specific information within the annual report.-
 1
1 -
2
-
3
-
4
-
5
-
6
-
7
-
8
-
9
-
10
-
11
-
12
-
13
-
14
-
15
-
16
-
17
-
18
-
19
-
20
-
21
-
22
-
23
-
24
-
25
-
26
-
27
-
28
-
29
-
30
-
31
-
32
-
33
-
34
-
35
-
36
-
37
-
38
-
39
-
40
-
41
-
42
-
43
-
44
-
45
-
46
-
47
-
 48
48 -
 49
49 -
 50
50 -
 51
51 -
 52
52 -
 53
53 -
 54
54 -
 55
55 -
 56
56 -
 57
57 -
 58
58 -
 59
59 -
 60
60 -
 61
61 -
 62
62 -
 63
63 -
 64
64 -
 65
65 -
 66
66 -
 67
67 -
 68
68 -
69
-
70
-
71
-
72
-
73
-
74
-
75
-
76
-
77
-
78
-
79
-
80
-
81
-
82
-
83
-
84
-
85
-
86
-
87
-
88
-
89
-
90
-
91
-
92
-
93
-
94
-
95
-
96
-
97
-
98
-
99
-
100
-
101
-
102
-
103
-
104
-
105
-
106
-
107
-
108
-
109
-
110
-
111
-
112
 |
 |
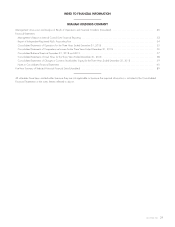
MANAGEMENT’S DISCUSSION AND ANALYSIS OF RESULTS OF OPERATIONS AND FINANCIAL CONDITION
This analysis should be read in conjunction with the Consolidated
Financial Statements and the notes thereto.
OVERVIEW
Graham Holdings Company is a diversified education and media
company, with education as the largest business. Through its
subsidiary Kaplan, Inc., the Company provides extensive world-
wide education services for individuals, schools and businesses. The
Company also operates principally in two areas of the media
industry: cable and television broadcasting. The Company’s business
units are diverse and subject to different trends and risks.
The Company’s education division is the largest operating division
of the Company, accounting for about 62.4% of the Company’s
consolidated revenues in 2013. The Company has devoted
significant resources and attention to this division for many years,
given the attractiveness of investment opportunities and growth
prospects during this time. In response to student demand levels,
Kaplan has formulated and implemented restructuring plans at many
of its businesses, resulting in significant costs in order to establish
lower cost levels in future periods. Kaplan may develop additional
restructuring plans as management continues to evaluate Kaplan’s
cost structure. Kaplan is organized into the following three operating
segments: Kaplan Higher Education (KHE), Kaplan Test Preparation
(KTP) and Kaplan International.
KHE is the largest segment of Kaplan, representing 50% of total
Kaplan revenues in 2013. KHE’s revenue declined in 2013,
largely due to enrollment declines arising from generally lower
demand, along with significant restructuring activities, including
school closures. KHE’s restructuring costs totaled $19.5 million in
2013. Operating income at KHE improved substantially due
primarily to expense reductions from lower enrollments and
restructuring activities.
Kaplan International reported revenue growth for 2013 due to
enrollment growth in the pathways, English-language and Singapore
higher education programs. Kaplan International results improved in
2013 due to a reduction in operating losses in Australia from lower
restructuring costs and continued strong results in Singapore, offset by
lower earnings in professional training in the U.K. Restructuring costs
at Kaplan International totaled $5.8 million in 2013.
Operating results for KTP improved in 2013 due primarily to
increased revenues.
Kaplan made one acquisition in 2013, three acquisitions in 2012
and five acquisitions in 2011. None of these was individually
significant.
The cable division continues to grow its high-speed data subscribers
and continues to make substantial capital investments. The division
is focused on retention of its high-value subscribers and on churn
reduction, as well as growth in commercial sales.
The Company’s television broadcasting division reported a reduction
in revenues and in operating income in 2013 due primarily to
significant political and Olympics-related advertising included in
2012, offset in part by increased retransmission revenues.
With the recent Celtic Healthcare and Forney acquisitions,
the Company has invested in new lines of business
in 2012 and 2013.
The Company generates a significant amount of cash from its
businesses that is used to support its operations, pay down debt
and fund capital expenditures, share repurchases, dividends,
acquisitions and other investments.
RESULTS OF OPERATIONS — 2013 COMPARED TO 2012
Net income attributable to common shares was $236.0 million
($32.05 per share) for the year ended December 31, 2013,
compared to $131.2 million ($17.39 per share) for the year
ended December 31, 2012. Net income includes $46.1 million
($6.27 per share) and $60.1 million ($8.17 per share) in income
from discontinued operations for 2013 and 2012, respectively.
Income from continuing operations attributable to common shares
was $189.9 million ($25.78 per share) for 2013, compared to
$71.1 million ($9.22 per share) for 2012.
On October 1, 2013, the Company completed the sale of most of
its newspaper publishing businesses, including The Washington
Post. Consequently, income from continuing operations excludes
these sold businesses, which have been reclassified to discontinued
operations, net of tax, for all periods presented.
Items included in the Company’s income from continuing operations
for 2013 are listed below:
• $36.4 million in severance and restructuring charges at the
education division (after-tax impact of $25.3 million, or $3.46
per share);
• a $3.3 million noncash intangible and other long-lived assets
impairment charge at Kaplan (after-tax impact of $3.2 million, or
$0.44 per share);
• a $10.4 million write-down of a marketable equity security (after-
tax impact of $6.7 million, or $0.91 per share); and
• $13.4 million in non-operating unrealized foreign currency losses
(after-tax impact of $8.6 million, or $1.17 per share).
Items included in the Company’s income from continuing operations
for 2012 are listed below:
• $111.6 million noncash goodwill and other long-lived assets
impairment charge at KTP (after-tax impact of $81.9 million, or
$11.33 per share);
• $45.2 million in severance and restructuring charges at the
education division (after-tax impact of $32.9 million, or $4.53
per share);
• an $18.0 million write-down of a marketable equity security
(after-tax impact of $11.2 million, or $1.54 per share);
• a $5.8 million gain on the sale of a cost method investment
(after-tax impact of $3.7 million, or $0.48 per share); and
• $3.1 million in non-operating unrealized foreign currency gains
(after-tax impact of $2.0 million, or $0.27 per share).
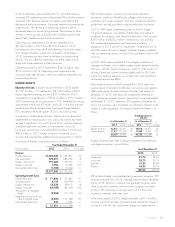
Revenue for 2013 was $3,487.9 million, up 1% from
$3,455.6 million in 2012. Revenues increased at the cable
division and in other businesses, offset by declines at the television
broadcasting and education divisions.
40 GRAHAM HOLDINGS COMPANY