Washington Post 2013 Annual Report Download - page 3
Download and view the complete annual report
Please find page 3 of the 2013 Washington Post annual report below. You can navigate through the pages in the report by either clicking on the pages listed below, or by using the keyword search tool below to find specific information within the annual report.-
 1
1 -
 2
2 -
 3
3 -
 4
4 -
 5
5 -
 6
6 -
 7
7 -
 8
8 -
 9
9 -
 10
10 -
 11
11 -
 12
12 -
 13
13 -
 14
14 -
15
-
16
-
17
-
18
-
19
-
20
-
21
-
22
-
23
-
24
-
25
-
26
-
27
-
28
-
29
-
30
-
31
-
32
-
33
-
34
-
35
-
36
-
37
-
38
-
39
-
40
-
41
-
42
-
43
-
44
-
45
-
46
-
47
-
48
-
49
-
50
-
51
-
52
-
53
-
54
-
55
-
56
-
57
-
58
-
59
-
60
-
61
-
62
-
63
-
64
-
65
-
66
-
67
-
68
-
69
-
70
-
71
-
72
-
73
-
74
-
75
-
76
-
77
-
78
-
79
-
80
-
81
-
82
-
83
-
84
-
85
-
86
-
87
-
88
-
89
-
90
-
91
-
92
-
93
-
94
-
95
-
96
-
97
-
98
-
99
-
100
-
101
-
102
-
103
-
104
-
105
-
106
-
107
-
108
-
109
-
110
-
111
-
112
 |
 |

2009
20 1 0
2 0 1 1
20 1 2
20 1 3
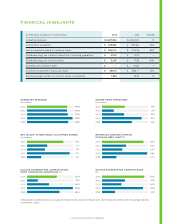
OPERATING REVENUES
($ in millions)
3,488
3,456
3,526
3,936
3,563
2009
20 1 0
2 0 1 1
20 1 2
20 1 3
DILUTED EARNINGS PER COMMON SHARE
FROM CONTINUING OPERATIONS ($)
25.78
9.22
19.03
39.65
28.16
2009
20 1 0
2 0 1 1
20 1 2
20 1 3
NET INCOME ATTRIBUTABLE TO COMMON SHARES
($ in millions)
236
1 3 1
1 16
277
92 2009
20 1 0
2 0 1 1
20 1 2
20 1 3
RETURN ON AVERAGE COMMON
STOCKHOLDERS’ EQUITY*
9.0%
5.2%
4.4%
9.8%
3. 1%
2009
20 1 0
2 0 1 1
20 1 2
20 1 3
INCOME FROM OPERATIONS
($ in millions)
346
179
334
602
453
2009
20 1 0
2 0 1 1
20 1 2
20 1 3
DILUTED EARNINGS PER COMMON SHARE
($)
32.05
17.39
14.70
31.04
9.78
1 | GRAHAM HOLDINGS COMPANY
(in thousands, except per share amounts) 2013 2012 Change
Operating revenues $ 3,487,864 $ 3,455,570 1%
Income from operations $ 345,565 $ 179,1 80 93%
Net income attributable to common shares $ 236,010 $ 131,21 8 80%
Diluted earnings per common share from continuing operations $ 25.78 $ 9.22 —
Diluted earnings per common share $ 32.05 $ 17.39 84%
Dividends per common share $ — $ 19.60 —
Common stockholders’ equity per share $ 446.73 $ 348.1 7 28%
Diluted average number of common shares outstanding 7,333 7,404 – 1 %
FINANCIAL HIGHLIGHTS
* Computed on a comparable basis, excluding the impact of the adjustment for pensions and other postretirement plans on average common
stockholders’ equity.