Washington Post 2013 Annual Report Download - page 74
Download and view the complete annual report
Please find page 74 of the 2013 Washington Post annual report below. You can navigate through the pages in the report by either clicking on the pages listed below, or by using the keyword search tool below to find specific information within the annual report.-
 1
1 -
2
-
3
-
4
-
5
-
6
-
7
-
8
-
9
-
10
-
11
-
12
-
13
-
14
-
15
-
16
-
17
-
18
-
19
-
20
-
21
-
22
-
23
-
24
-
25
-
26
-
27
-
28
-
29
-
30
-
31
-
32
-
33
-
34
-
35
-
36
-
37
-
38
-
39
-
40
-
41
-
42
-
43
-
44
-
45
-
46
-
47
-
48
-
49
-
50
-
51
-
52
-
53
-
54
-
55
-
56
-
57
-
58
-
59
-
60
-
61
-
62
-
63
-
 64
64 -
 65
65 -
 66
66 -
 67
67 -
 68
68 -
 69
69 -
 70
70 -
 71
71 -
 72
72 -
 73
73 -
 74
74 -
 75
75 -
 76
76 -
 77
77 -
 78
78 -
 79
79 -
 80
80 -
 81
81 -
 82
82 -
 83
83 -
 84
84 -
85
-
86
-
87
-
88
-
89
-
90
-
91
-
92
-
93
-
94
-
95
-
96
-
97
-
98
-
99
-
100
-
101
-
102
-
103
-
104
-
105
-
106
-
107
-
108
-
109
-
110
-
111
-
112
 |
 |

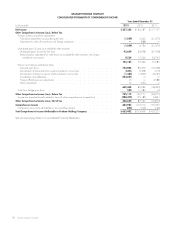
GRAHAM HOLDINGS COMPANY
CONSOLIDATED STATEMENTS OF COMPREHENSIVE INCOME
Year Ended December 31
(in thousands) 2013 2012 2011
Net Income ...................................................................... $ 237,345 $132,187 $117,157
Other Comprehensive Income (Loss), Before Tax
Foreign currency translation adjustments:
Translation adjustments arising during the year ......................................... (1,059) 5,622 (21,375)
Adjustment for sales of businesses with foreign operations ................................. —(888) —
(1,059) 4,734 (21,375)
Unrealized gains (losses) on available-for-sale securities:
Unrealized gains (losses) for the year ................................................ 95,629 33,098 (37,708)
Reclassification adjustment for write-down on available-for-sale securities, net of gain,
included in net income ........................................................ 9,554 17,226 53,793
105,183 50,324 16,085
Pension and other postretirement plans:
Actuarial gain (loss) ............................................................ 762,806 82,470 (16,048)
Amortization of net actuarial loss (gain) included in net income ............................. 3,096 9,368 (510)
Amortization of net prior service credit included in net income .............................. (1,383) (1,859) (3,925)
Curtailments and settlements ...................................................... (124,051) ——
Foreign affiliate pension adjustments ................................................ ——2,088
Other adjustments .............................................................. —(745) —
640,468 89,234 (18,395)
Cash flow hedge gain (loss) ........................................................ 520 (1,581) 14
Other Comprehensive Income (Loss), Before Tax .......................................... 745,112 142,711 (23,671)
Income tax (expense) benefit related to items of other comprehensive income (loss) ................. (298,472) (55,186) 6,861
Other Comprehensive Income (Loss), Net of Tax .......................................... 446,640 87,525 (16,810)
Comprehensive Income ............................................................. 683,985 219,712 100,347
Comprehensive income attributable to noncontrolling interests ................................ (503) (103) (126)
Total Comprehensive Income Attributable to Graham Holdings Company ....................... $ 683,482 $219,609 $100,221
See accompanying Notes to Consolidated Financial Statements.
56 GRAHAM HOLDINGS COMPANY