Washington Post 2013 Annual Report Download - page 75
Download and view the complete annual report
Please find page 75 of the 2013 Washington Post annual report below. You can navigate through the pages in the report by either clicking on the pages listed below, or by using the keyword search tool below to find specific information within the annual report.-
 1
1 -
2
-
3
-
4
-
5
-
6
-
7
-
8
-
9
-
10
-
11
-
12
-
13
-
14
-
15
-
16
-
17
-
18
-
19
-
20
-
21
-
22
-
23
-
24
-
25
-
26
-
27
-
28
-
29
-
30
-
31
-
32
-
33
-
34
-
35
-
36
-
37
-
38
-
39
-
40
-
41
-
42
-
43
-
44
-
45
-
46
-
47
-
48
-
49
-
50
-
51
-
52
-
53
-
54
-
55
-
56
-
57
-
58
-
59
-
60
-
61
-
62
-
63
-
64
-
 65
65 -
 66
66 -
 67
67 -
 68
68 -
 69
69 -
 70
70 -
 71
71 -
 72
72 -
 73
73 -
 74
74 -
 75
75 -
 76
76 -
 77
77 -
 78
78 -
 79
79 -
 80
80 -
 81
81 -
 82
82 -
 83
83 -
 84
84 -
 85
85 -
86
-
87
-
88
-
89
-
90
-
91
-
92
-
93
-
94
-
95
-
96
-
97
-
98
-
99
-
100
-
101
-
102
-
103
-
104
-
105
-
106
-
107
-
108
-
109
-
110
-
111
-
112
 |
 |

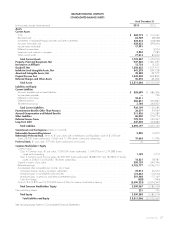
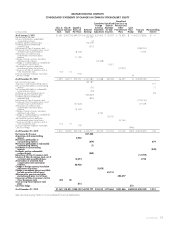
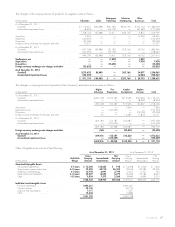
GRAHAM HOLDINGS COMPANY
CONSOLIDATED BALANCE SHEETS
As of December 31
(in thousands, except share amounts) 2013 2012
Assets
Current Assets
Cash ................................................................................ $ 569,719 $ 512,431
Restricted cash ......................................................................... 83,769 28,538
Investments in marketable equity securities and other investments ..................................... 522,318 418,938
Accounts receivable, net .................................................................. 428,653 399,204
Income taxes receivable .................................................................. 17,991 —
Deferred income taxes ................................................................... —3,974
Inventories and contracts in progress ......................................................... 2,924 7,985
Other current assets ...................................................................... 77,013 82,692
Total Current Assets ................................................................ 1,702,387 1,453,762
Property, Plant and Equipment, Net ....................................................... 927,542 1,081,237
Investments in Affiliates ................................................................. 15,754 15,535
Goodwill, Net ........................................................................ 1,288,622 1,317,915
Indefinite-Lived Intangible Assets, Net ...................................................... 541,278 539,728
Amortized Intangible Assets, Net .......................................................... 39,588 45,577
Prepaid Pension Cost ................................................................... 1,245,505 604,823
Deferred Charges and Other Assets ....................................................... 50,370 46,492
Total Assets ...................................................................... $ 5,811,046 $ 5,105,069
Liabilities and Equity
Current Liabilities
Accounts payable and accrued liabilities ...................................................... $ 505,699 $ 486,396
Income taxes payable .................................................................... —726
Deferred income taxes ................................................................... 58,411 —
Deferred revenue ....................................................................... 366,831 395,837
Short-term borrowings .................................................................... 3,168 243,327
Total Current Liabilities .............................................................. 934,109 1,126,286
Postretirement Benefits Other Than Pensions ................................................. 36,219 59,949
Accrued Compensation and Related Benefits ................................................. 211,526 216,280
Other Liabilities ....................................................................... 86,000 109,774
Deferred Income Taxes ................................................................. 778,735 529,427
Long-Term Debt ....................................................................... 447,608 453,384
Total Liabilities .................................................................... 2,494,197 2,495,100
Commitments and Contingencies (Notes 17 and 18)
Redeemable Noncontrolling Interest .......................................................... 5,896 12,655
Redeemable Preferred Stock, Series A, $1 par value, with a redemption and liquidation value of $1,000 per
share; 23,000 shares authorized; 10,665 and 11,096 shares issued and outstanding .................... 10,665 11,096
Preferred Stock, $1 par value; 977,000 shares authorized, none issued ................................ ——
Common Stockholders’ Equity
Common stock
Class A Common stock, $1 par value; 7,000,000 shares authorized; 1,169,073 and 1,219,383 shares
issued and outstanding ............................................................... 1,169 1,219
Class B Common stock, $1 par value; 40,000,000 shares authorized; 18,830,927 and 18,780,617 shares
issued; 6,218,051 and 6,208,118 shares outstanding ....................................... 18,831 18,781
Capital in excess of par value .............................................................. 288,129 240,746
Retained earnings ....................................................................... 4,782,777 4,546,775
Accumulated other comprehensive income, net of taxes
Cumulative foreign currency translation adjustment ............................................. 25,013 26,072
Unrealized gain on available-for-sale securities ................................................ 173,663 110,553
Unrealized gain on pensions and other postretirement plans ...................................... 501,446 117,169
Cash flow hedge ..................................................................... (628) (940)
Cost of 12,612,876 and 12,572,499 shares of Class B common stock held in treasury .................. (2,490,333) (2,474,347)
Total Common Stockholders’ Equity .................................................... 3,300,067 2,586,028
Noncontrolling interests ..................................................................... 221 190
Total Equity ...................................................................... 3,300,288 2,586,218
Total Liabilities and Equity ......................................................... $ 5,811,046 $ 5,105,069
See accompanying Notes to Consolidated Financial Statements.
2013 FORM 10-K 57