Washington Post 2013 Annual Report Download - page 104
Download and view the complete annual report
Please find page 104 of the 2013 Washington Post annual report below. You can navigate through the pages in the report by either clicking on the pages listed below, or by using the keyword search tool below to find specific information within the annual report.-
 1
1 -
2
-
3
-
4
-
5
-
6
-
7
-
8
-
9
-
10
-
11
-
12
-
13
-
14
-
15
-
16
-
17
-
18
-
19
-
20
-
21
-
22
-
23
-
24
-
25
-
26
-
27
-
28
-
29
-
30
-
31
-
32
-
33
-
34
-
35
-
36
-
37
-
38
-
39
-
40
-
41
-
42
-
43
-
44
-
45
-
46
-
47
-
48
-
49
-
50
-
51
-
52
-
53
-
54
-
55
-
56
-
57
-
58
-
59
-
60
-
61
-
62
-
63
-
64
-
65
-
66
-
67
-
68
-
69
-
70
-
71
-
72
-
73
-
74
-
75
-
76
-
77
-
78
-
79
-
80
-
81
-
82
-
83
-
84
-
85
-
86
-
87
-
88
-
89
-
90
-
91
-
92
-
93
-
 94
94 -
 95
95 -
 96
96 -
 97
97 -
 98
98 -
 99
99 -
 100
100 -
 101
101 -
 102
102 -
 103
103 -
 104
104 -
 105
105 -
 106
106 -
 107
107 -
 108
108 -
 109
109 -
 110
110 -
 111
111 -
 112
112
 |
 |

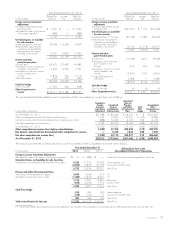
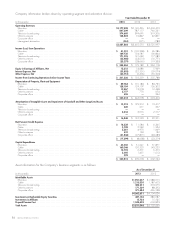
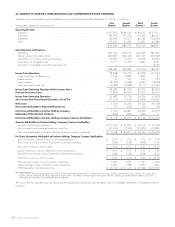
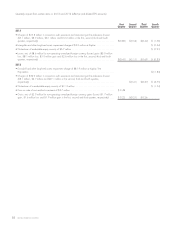
20. SUMMARY OF QUARTERLY OPERATING RESULTS AND COMPREHENSIVE INCOME (UNAUDITED)
Quarterly results of operations and comprehensive income for the year ended December 31, 2013, is as follows:
(in thousands, except per share amounts) First
Quarter Second
Quarter Third
Quarter(1) Fourth
Quarter
Operating Revenues
Education .......................................................... $527,815 $548,230 $546,452 $555,011
Subscriber .......................................................... 186,790 192,273 190,302 186,297
Advertising .......................................................... 82,994 96,670 84,444 102,208
Other ............................................................. 39,241 52,423 51,331 45,383
836,840 889,596 872,529 888,899
Operating Costs and Expenses
Operating .......................................................... 381,965 400,515 400,939 381,492
Selling, general and administrative ........................................ 337,865 323,182 331,247 335,028
Depreciation of property, plant and equipment ............................... 59,895 57,816 55,633 59,874
Amortization of intangible assets .......................................... 3,717 3,313 2,837 3,731
Impairment of intangibles and other long-lived assets ........................... ———3,250
783,442 784,826 790,656 783,375
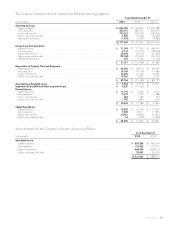
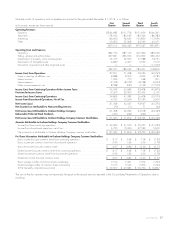
Income from Operations 53,398 104,770 81,873 105,524
Equity in earnings of affiliates, net ......................................... 3,418 3,868 5,892 37
Interest income ....................................................... 510 522 642 590
Interest expense ...................................................... (8,960) (9,048) (9,221) (8,838)
Other (expense) income, net ............................................. (4,083) (12,858) 8,110 (14,920)
Income from Continuing Operations Before Income Taxes ........................ 44,283 87,254 87,296 82,393
Provision for Income Taxes ............................................... 17,800 34,500 31,000 26,700
Income from Continuing Operations ........................................ 26,483 52,754 56,296 55,693
(Loss) Income from Discontinued Operations, Net of Tax ......................... (21,224) (7,620) (25,872) 100,835
Net Income ........................................................... 5,259 45,134 30,424 156,528
Net Income Attributable to Noncontrolling Interests ............................. (97) (253) (75) (55)
Net Income Attributable to Graham Holdings Company ......................... 5,162 44,881 30,349 156,473
Redeemable Preferred Stock Dividends ...................................... (444) (206) (205) —
Net Income Attributable to Graham Holdings Company Common Stockholders ........ $ 4,718 $ 44,675 $ 30,144 $156,473
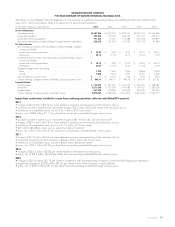
Amounts Attributable to Graham Holdings Company Common Stockholders
Income from continuing operations ........................................ $ 25,942 $ 52,295 $ 56,016 $ 55,638
(Loss) income from discontinued operations, net of tax .......................... (21,224) (7,620) (25,872) 100,835
Net income attributable to Graham Holdings Company common stockholders ......... $ 4,718 $ 44,675 $ 30,144 $156,473
Per Share Information Attributable to Graham Holdings Company Common Stockholders
Basic income per common share from continuing operations ...................... $ 3.50 $ 7.05 $ 7.55 $ 7.54
Basic (loss) income per common share from discontinued operations ................ (2.86) (1.03) (3.48) 13.66
Basic net income per common share ....................................... $ 0.64 $ 6.02 $ 4.07 $ 21.20
Diluted income per common share from continuing operations ..................... $ 3.50 $ 7.05 $ 7.53 $ 7.52
Diluted (loss) income per common share from discontinued operations ............... (2.86) (1.03) (3.48) 13.62
Diluted net income per common share ...................................... $ 0.64 $ 6.02 $ 4.05 $ 21.14
Basic average number of common shares outstanding .......................... 7,227 7,229 7,231 7,266
Diluted average number of common shares outstanding ......................... 7,266 7,283 7,337 7,347
2013 Quarterly comprehensive income ..................................... $ 29,129 $ 61,125 $ 37,533 $555,695
(1) Other revenue and operating expenses of $29.9 million from the third quarter of 2013 have been revised to correctly present revenue on a net basis for certain third
quarter contracts that were previously reported on a gross basis. The amounts did not impact net income, and the Company concluded that the amounts were not
material to the Company’s consolidated financial statements.
The sum of the four quarters may not necessarily be equal to the annual amounts reported in the Consolidated Statements of Operations due to
rounding.
86 GRAHAM HOLDINGS COMPANY