Washington Post 2013 Annual Report Download - page 105
Download and view the complete annual report
Please find page 105 of the 2013 Washington Post annual report below. You can navigate through the pages in the report by either clicking on the pages listed below, or by using the keyword search tool below to find specific information within the annual report.-
 1
1 -
2
-
3
-
4
-
5
-
6
-
7
-
8
-
9
-
10
-
11
-
12
-
13
-
14
-
15
-
16
-
17
-
18
-
19
-
20
-
21
-
22
-
23
-
24
-
25
-
26
-
27
-
28
-
29
-
30
-
31
-
32
-
33
-
34
-
35
-
36
-
37
-
38
-
39
-
40
-
41
-
42
-
43
-
44
-
45
-
46
-
47
-
48
-
49
-
50
-
51
-
52
-
53
-
54
-
55
-
56
-
57
-
58
-
59
-
60
-
61
-
62
-
63
-
64
-
65
-
66
-
67
-
68
-
69
-
70
-
71
-
72
-
73
-
74
-
75
-
76
-
77
-
78
-
79
-
80
-
81
-
82
-
83
-
84
-
85
-
86
-
87
-
88
-
89
-
90
-
91
-
92
-
93
-
94
-
 95
95 -
 96
96 -
 97
97 -
 98
98 -
 99
99 -
 100
100 -
 101
101 -
 102
102 -
 103
103 -
 104
104 -
 105
105 -
 106
106 -
 107
107 -
 108
108 -
 109
109 -
 110
110 -
 111
111 -
 112
112
 |
 |

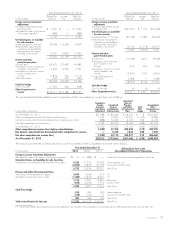
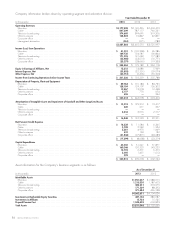
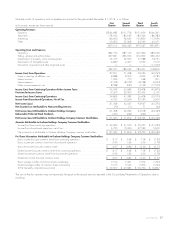
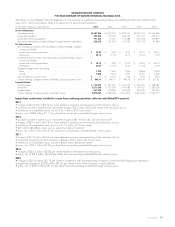
Quarterly results of operations and comprehensive income for the year ended December 31, 2012, is as follows:
(in thousands, except per share amount) First
Quarter Second
Quarter Third
Quarter Fourth
Quarter
Operating Revenues
Education .......................................................... $546,685 $551,774 $551,696 $546,341
Subscriber .......................................................... 178,022 182,639 185,326 186,383
Advertising .......................................................... 82,600 94,649 105,855 117,696
Other ............................................................. 20,305 25,368 34,760 45,471
827,612 854,430 877,637 895,891
Operating Costs and Expenses
Operating .......................................................... 382,106 387,167 407,364 389,620
Selling, general and administrative ........................................ 347,841 335,054 314,359 336,262
Depreciation of property, plant and equipment ............................... 56,165 56,594 57,588 73,731
Amortization of intangible assets .......................................... 3,839 4,407 5,090 7,610
Impairment of goodwill and other long-lived assets ............................. ———111,593
789,951 783,222 784,401 918,816
Income (Loss) from Operations ............................................ 37,661 71,208 93,236 (22,925)
Equity in earnings of affiliates, net ......................................... 3,888 3,314 4,099 2,785
Interest income ....................................................... 1,069 775 648 901
Interest expense ...................................................... (9,163) (8,979) (8,738) (9,064)
Other income (expense), net ............................................. 8,588 (635) 4,163 (17,572)
Income (Loss) from Continuing Operations Before Income Taxes ................... 42,043 65,683 93,408 (45,875)
Provision for Income Taxes ............................................... 17,200 23,900 37,000 5,100
Income (Loss) from Continuing Operations ................................... 24,843 41,783 56,408 (50,975)
Income from Discontinued Operations, Net of Tax .............................. 6,725 10,264 37,539 5,600
Net Income (Loss) ...................................................... 31,568 52,047 93,947 (45,375)
Net (Income) Loss Attributable to Noncontrolling Interests ........................ (70) (11) 71 (64)
Net Income (Loss) Attributable to Graham Holdings Company ..................... 31,498 52,036 94,018 (45,439)
Redeemable Preferred Stock Dividends ...................................... (451) (222) (222) —
Net Income (Loss) Attributable to Graham Holdings Company Common Stockholders . . . $ 31,047 $ 51,814 $ 93,796 $ (45,439)
Amounts Attributable to Graham Holdings Company Common Stockholders
Income (loss) from continuing operations .................................... $ 24,322 $ 41,550 $ 56,257 $ (51,039)
Income from discontinued operations, net of tax ............................... 6,725 10,264 37,539 5,600
Net income (loss) attributable to Graham Holdings Company common stockholders ..... $ 31,047 $ 51,814 $ 93,796 $ (45,439)
Per Share Information Attributable to Graham Holdings Company Common Stockholders
Basic income (loss) per common share from continuing operations .................. $ 3.17 $ 5.48 $ 7.58 $ (7.35)
Basic income per common share from discontinued operations .................... 0.90 1.36 5.06 0.78
Basic net income (loss) per common share ................................... $ 4.07 $ 6.84 $ 12.64 $ (6.57)
Diluted income (loss) per common share from continuing operations ................ $ 3.17 $ 5.48 $ 7.58 $ (7.35)
Diluted income per common share from discontinued operations ................... 0.90 1.36 5.06 0.78
Diluted net income (loss) per common share .................................. $ 4.07 $ 6.84 $ 12.64 $ (6.57)
Basic average number of common shares outstanding .......................... 7,514 7,431 7,272 7,223
Diluted average number of common shares outstanding ......................... 7,615 7,545 7,376 7,223
2012 Quarterly comprehensive income ..................................... $ 59,907 $ 47,085 $ 95,760 $ 16,857
The sum of the four quarters may not necessarily be equal to the annual amounts reported in the Consolidated Statements of Operations due to
rounding.
2013 FORM 10-K 87