Washington Post 2013 Annual Report Download - page 62
Download and view the complete annual report
Please find page 62 of the 2013 Washington Post annual report below. You can navigate through the pages in the report by either clicking on the pages listed below, or by using the keyword search tool below to find specific information within the annual report.-
 1
1 -
2
-
3
-
4
-
5
-
6
-
7
-
8
-
9
-
10
-
11
-
12
-
13
-
14
-
15
-
16
-
17
-
18
-
19
-
20
-
21
-
22
-
23
-
24
-
25
-
26
-
27
-
28
-
29
-
30
-
31
-
32
-
33
-
34
-
35
-
36
-
37
-
38
-
39
-
40
-
41
-
42
-
43
-
44
-
45
-
46
-
47
-
48
-
49
-
50
-
51
-
 52
52 -
 53
53 -
 54
54 -
 55
55 -
 56
56 -
 57
57 -
 58
58 -
 59
59 -
 60
60 -
 61
61 -
 62
62 -
 63
63 -
 64
64 -
 65
65 -
 66
66 -
 67
67 -
 68
68 -
 69
69 -
 70
70 -
 71
71 -
 72
72 -
73
-
74
-
75
-
76
-
77
-
78
-
79
-
80
-
81
-
82
-
83
-
84
-
85
-
86
-
87
-
88
-
89
-
90
-
91
-
92
-
93
-
94
-
95
-
96
-
97
-
98
-
99
-
100
-
101
-
102
-
103
-
104
-
105
-
106
-
107
-
108
-
109
-
110
-
111
-
112
 |
 |

In 2012, education revenue decreased 9%, subscriber revenue
increased 3%, advertising revenue increased 22% and other
revenue increased 51%. Revenue declines at Kaplan accounted for
the decrease in education revenue. Subscriber revenue increased at
the cable division. The increase in advertising revenue is due to
increased television broadcasting revenue. The increase in other
revenue is due to higher sales at SocialCode and Slate, as well as
from the newly acquired Celtic Healthcare.
Operating costs and expenses for the year increased 3% to
$3,276.4 million in 2012, from $3,191.9 million in 2011.
Excluding the noncash goodwill and other long-lived assets impair-
ment charge at Kaplan, overall costs at Kaplan declined in 2012.
This was offset by increased costs at the television broadcasting and
cable divisions, along with higher expenses in other businesses.
Operating income for 2012 decreased to $179.2 million, from
$334.1 million in 2011. Operating results declined at all of the
Company’s divisions, except for the television broadcasting division.
DIVISION RESULTS
Education Division. Education division revenue in 2012 totaled
$2,196.5 million, a 9% decline from $2,404.5 million in 2011.
Excluding revenue from acquired businesses, education division
revenue declined 10% in 2012. Kaplan reported an operating loss
of $105.4 million for 2012, compared to operating income of
$96.3 million in 2011. Kaplan’s 2012 operating results were
adversely impacted by a significant decline in KHE results; a
$111.6 million noncash goodwill and other long-lived assets impair-
ment charge related to KTP; and $45.2 million in restructuring costs.
These were offset by improved results at KTP and Kaplan International.
In response to student demand levels, Kaplan has formulated and
implemented restructuring plans at its various businesses that have
resulted in significant costs in 2012 and 2011, with the objective
of establishing lower cost levels in future periods. Across all
businesses, restructuring costs totaled $45.2 million in 2012 and
$28.9 million in 2011.
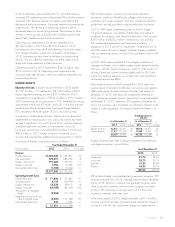
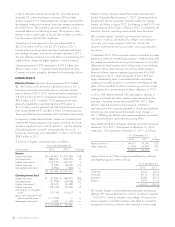
A summary of Kaplan’s operating results is as follows:
Year Ended December 31
(in thousands) 2012 2011 % Change
Revenue
Higher education ....... $1,149,407 $1,399,583 (18)
Test preparation ........ 284,252 303,093 (6)
Kaplan international ..... 753,790 690,226 9
Kaplan corporate ....... 15,039 18,940 (21)
Intersegment elimination . . (5,992) (7,383) —
$2,196,496 $2,404,459 (9)
Operating Income (Loss)
Higher education ....... $ 27,245 $ 148,915 (82)
Test preparation ........ (10,799) (28,498) 62
Kaplan international ..... 49,612 46,498 7
Kaplan corporate ....... (43,160) (50,092) 14
Amortization of intangible
assets .............. (17,719) (19,417) 9
Impairment of goodwill and
other long-lived assets . . (111,593) ——
Intersegment elimination . . 1,046 (1,120) —
$ (105,368) $ 96,286 —
Kaplan’s Colloquy business moved from Kaplan International to
Kaplan Corporate effective January 1, 2013. Operating results at
the education division have been restated to reflect this change.
Kaplan sold Kidum in August 2012, EduNeering in April 2012 and
Kaplan Learning Technologies in February 2012. Consequently, the
education division’s operating results exclude these businesses.
KHE includes Kaplan’s domestic postsecondary education
businesses, made up of fixed-facility colleges and online post-
secondary and career programs. KHE also includes the
domestic professional training and other continuing education
businesses.
In September 2012, KHE announced a plan to consolidate its market
presence at certain of its fixed-facility campuses. Under this plan, KHE
has ceased new enrollments at nine ground campuses as it considers
alternatives for these locations and is in the process of consolidating
operations of four other campuses into existing, nearby locations.
Revenues at these campuses represent approximately 4% of KHE’s
total revenues in 2012. In the fourth quarter of 2012, KHE also
began implementing plans to consolidate facilities and reduce
workforce at its online programs. In connection with these and other
plans, KHE incurred $23.4 million in restructuring costs from accele-
rated depreciation, and severance and lease obligations in 2012.
In 2012, KHE revenue declined 18% due largely to declines in
average enrollments that reflect weaker market demand over the
past year. Operating income decreased 82% for 2012. These
declines were due primarily to lower revenue, a decline in
operating results from campuses planned for closure and significant
restructuring costs noted above that exceed similar charges in
2011. Offsetting the declines were expense reductions associated
with lower enrollments and recent restructuring efforts.
New student enrollments at Kaplan University and Other Campuses
decreased 1% in 2012. Total students at December 31, 2012,
were down 12% compared to December 31, 2011, as follows:
As of December 31 %
Change2012 2011
Kaplan University ............ 44,371 50,190 (12)
Other Campuses ............ 21,099 24,360 (13)
65,470 74,550 (12)
Kaplan University and Other Campuses enrollments by certificate
and degree programs, were as follows:
As of December 31
2012 2011
Certificate ........................ 23.2% 23.6%
Associate’s ........................ 29.1% 30.3%
Bachelor’s ........................ 33.8% 34.6%
Master’s .......................... 13.9% 11.5%
100.0% 100.0%
KTP includes Kaplan’s standardized test preparation and tutoring
offerings. KTP revenue declined 6% in 2012. Enrollment increased
11% for 2012, driven by strength in pre-college, nursing and bar
review programs. Enrollment increases were offset by competitive
pricing pressure and a continued shift in demand to lower priced
44 GRAHAM HOLDINGS COMPANY