Washington Post 2013 Annual Report Download - page 94
Download and view the complete annual report
Please find page 94 of the 2013 Washington Post annual report below. You can navigate through the pages in the report by either clicking on the pages listed below, or by using the keyword search tool below to find specific information within the annual report.-
 1
1 -
2
-
3
-
4
-
5
-
6
-
7
-
8
-
9
-
10
-
11
-
12
-
13
-
14
-
15
-
16
-
17
-
18
-
19
-
20
-
21
-
22
-
23
-
24
-
25
-
26
-
27
-
28
-
29
-
30
-
31
-
32
-
33
-
34
-
35
-
36
-
37
-
38
-
39
-
40
-
41
-
42
-
43
-
44
-
45
-
46
-
47
-
48
-
49
-
50
-
51
-
52
-
53
-
54
-
55
-
56
-
57
-
58
-
59
-
60
-
61
-
62
-
63
-
64
-
65
-
66
-
67
-
68
-
69
-
70
-
71
-
72
-
73
-
74
-
75
-
76
-
77
-
78
-
79
-
80
-
81
-
82
-
83
-
 84
84 -
 85
85 -
 86
86 -
 87
87 -
 88
88 -
 89
89 -
 90
90 -
 91
91 -
 92
92 -
 93
93 -
 94
94 -
 95
95 -
 96
96 -
 97
97 -
 98
98 -
 99
99 -
 100
100 -
 101
101 -
 102
102 -
 103
103 -
 104
104 -
105
-
106
-
107
-
108
-
109
-
110
-
111
-
112
 |
 |

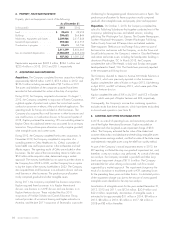
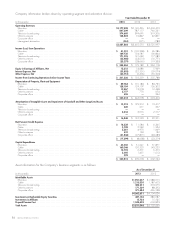
The net periodic cost (benefit) for the Company’s pension plans, as
reported above, includes pension cost of $19.5 million, $24.7 million
and $18.7 million reported in discontinued operations for 2013,
2012 and 2011, respectively. The net periodic cost for the Company’s
SERP, as reported above, includes cost of $0.6 million, $0.6 million
and $0.8 million reported in discontinued operations for 2013, 2012
and 2011, respectively. The early retirement programs and special
separation benefit expenses are also included in discontinued opera-
tions for 2013, 2012 and 2011. The curtailments and settlements are
included in the gain on sale of Publishing Subsidiaries, which is also
reported in discontinued operations.
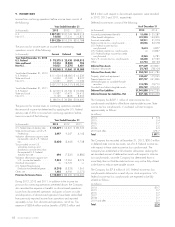
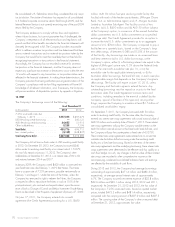
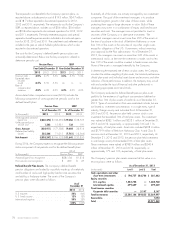
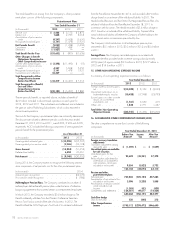
The costs for the Company’s defined benefit pension plans are
actuarially determined. Below are the key assumptions utilized to
determine periodic cost:
Pension Plans SERP
Year Ended December 31 Year Ended December 31
2013 2012 2011 2013 2012 2011
Discount rate . . . 4.0% 4.7% 5.6% 4.0% 4.7% 5.6%
Expected return
on plan
assets ...... 6.5% 6.5% 6.5% ———
Rate of
compensation
increase .... 4.0% 4.0% 4.0% 4.0% 4.0% 4.0%
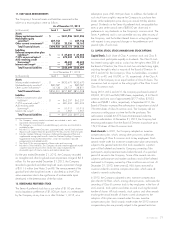
Accumulated other comprehensive income (AOCI) includes the
following components of unrecognized net periodic cost for the
defined benefit plans:
Pension Plans SERP
As of December 31 As of December 31
(in thousands) 2013 2012 2013 2012
Unrecognized actuarial
(gain) loss ........ $(840,273) $(193,469) $19,266 $ 33,725
Unrecognized prior
service cost ....... 1,362 15,931 136 191
Gross Amount ...... (838,911) (177,538) 19,402 33,916
Deferred tax liability
(asset) ........... 335,564 71,015 (7,761) (13,566)
Net Amount ........ $(503,347) $(106,523) $11,641 $ 20,350
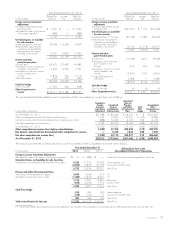
During 2014, the Company expects to recognize the following amorti-
zation components of net periodic cost for the defined benefit plans:
2014
(in thousands) Pension Plans SERP
Actuarial (gain) loss recognition ......... $(28,154) $1,313
Prior service cost recognition ........... $ 329 $ 47
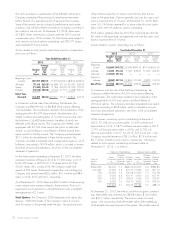
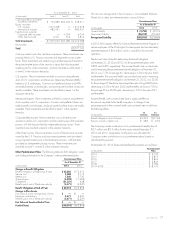
Defined Benefit Plan Assets. The Company’s defined benefit
pension obligations are funded by a portfolio made up of a relatively
small number of stocks and high-quality fixed-income securities that
are held by a third-party trustee. The assets of the Company’s
pension plans were allocated as follows:
As of
December 31
2013 2012
U.S. equities ............................. 58% 64%
U.S. fixed income .......................... 12% 13%
International equities ........................ 30% 23%
100% 100%
Essentially all of the assets are actively managed by two investment
companies. The goal of the investment managers is to produce
moderate long-term growth in the value of these assets, while
protecting them against large decreases in value. Both of these
managers may invest in a combination of equity and fixed-income
securities and cash. The managers are not permitted to invest in
securities of the Company or in alternative investments. The
investment managers cannot invest more than 20% of the assets at
the time of purchase in the stock of Berkshire Hathaway or more
than 10% of the assets in the securities of any other single issuer,
except for obligations of the U.S. Government, without receiving
prior approval by the Plan administrator. As of December 31,
2013, the managers can invest no more than 24% of the assets in
international stocks, at the time the investment is made, and no less
than 10% of the assets could be invested in fixed-income securities.
None of the assets is managed internally by the Company.
In determining the expected rate of return on plan assets, the Company
considers the relative weighting of plan assets, the historical performance
of total plan assets and individual asset classes and economic and other
indicators of future performance. In addition, the Company may consult
with and consider the input of financial and other professionals in
developing appropriate return benchmarks.
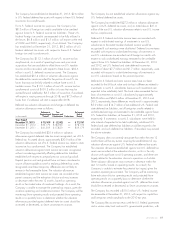
The Company evaluated its defined benefit pension plan asset
portfolio for the existence of significant concentrations (defined as
greater than 10% of plan assets) of credit risk as of December 31,
2013. Types of concentrations that were evaluated include, but are
not limited to, investment concentrations in a single entity, type of
industry, foreign country and individual fund. At December 31,
2013 and 2012, the pension plan held common stock in one
investment that exceeded 10% of total plan assets. This investment
was valued at $382.1 million and $223.1 million at December 31,
2013 and 2012, respectively, or approximately 16% and 11%,
respectively, of total plan assets. Assets also included $208.4 million
and $179.9 million of Berkshire Hathaway Class A and Class B
common stock at December 31, 2013 and 2012, respectively. At
December 31, 2013 and 2012, the pension plan held investments
in one foreign country that exceeded 10% of total plan assets.
These investments were valued at $398.9 million and $240.4
million at December 31, 2013 and 2012, respectively, or
approximately 17% and 12%, respectively, of total plan assets.
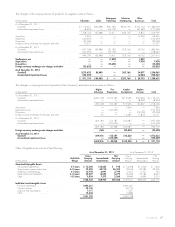
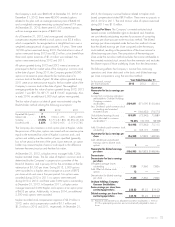
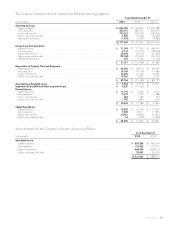
The Company’s pension plan assets measured at fair value on a
recurring basis were as follows:
As of December 31, 2013
(in thousands) Level 1 Level 2 Total
Cash equivalents and other
short-term investments .... $ 196,757 $84,706 $ 281,463
Equity securities ...........
U.S. equities ............ 1,383,738 — 1,383,738
International equities ...... 699,649 — 699,649
Fixed-income securities ......
Corporate debt securities .. — 5,147 5,147
Total Investments .......... $2,280,144 $89,853 $2,369,997
Receivables ............... 1,852
Total .................... $2,371,849
76 GRAHAM HOLDINGS COMPANY