Washington Post 2013 Annual Report Download - page 73
Download and view the complete annual report
Please find page 73 of the 2013 Washington Post annual report below. You can navigate through the pages in the report by either clicking on the pages listed below, or by using the keyword search tool below to find specific information within the annual report.-
 1
1 -
2
-
3
-
4
-
5
-
6
-
7
-
8
-
9
-
10
-
11
-
12
-
13
-
14
-
15
-
16
-
17
-
18
-
19
-
20
-
21
-
22
-
23
-
24
-
25
-
26
-
27
-
28
-
29
-
30
-
31
-
32
-
33
-
34
-
35
-
36
-
37
-
38
-
39
-
40
-
41
-
42
-
43
-
44
-
45
-
46
-
47
-
48
-
49
-
50
-
51
-
52
-
53
-
54
-
55
-
56
-
57
-
58
-
59
-
60
-
61
-
62
-
 63
63 -
 64
64 -
 65
65 -
 66
66 -
 67
67 -
 68
68 -
 69
69 -
 70
70 -
 71
71 -
 72
72 -
 73
73 -
 74
74 -
 75
75 -
 76
76 -
 77
77 -
 78
78 -
 79
79 -
 80
80 -
 81
81 -
 82
82 -
 83
83 -
84
-
85
-
86
-
87
-
88
-
89
-
90
-
91
-
92
-
93
-
94
-
95
-
96
-
97
-
98
-
99
-
100
-
101
-
102
-
103
-
104
-
105
-
106
-
107
-
108
-
109
-
110
-
111
-
112
 |
 |

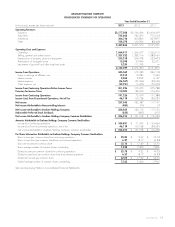
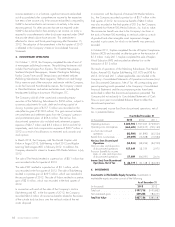
GRAHAM HOLDINGS COMPANY
CONSOLIDATED STATEMENTS OF OPERATIONS
Year Ended December 31
(in thousands, except per share amounts) 2013 2012 2011
Operating Revenues
Education ................................................................. $2,177,508 $2,196,496 $2,404,459
Subscriber ................................................................. 755,662 732,370 710,253
Advertising ................................................................ 366,316 400,800 327,877
Other .................................................................... 188,378 125,904 83,408
3,487,864 3,455,570 3,525,997
Operating Costs and Expenses
Operating ................................................................. 1,564,911 1,566,257 1,562,615
Selling, general and administrative ............................................... 1,327,322 1,333,516 1,383,660
Depreciation of property, plant and equipment ...................................... 233,218 244,078 223,403
Amortization of intangible assets ................................................. 13,598 20,946 22,201
Impairment of goodwill and other long-lived assets ................................... 3,250 111,593 —
3,142,299 3,276,390 3,191,879
Income from Operations ....................................................... 345,565 179,180 334,118
Equity in earnings of affiliates, net ................................................ 13,215 14,086 5,949
Interest income ............................................................. 2,264 3,393 4,147
Interest expense ............................................................. (36,067) (35,944) (33,226)
Other expense, net .......................................................... (23,751) (5,456) (55,200)
Income from Continuing Operations Before Income Taxes .............................. 301,226 155,259 255,788
Provision for Income Taxes ..................................................... 110,000 83,200 104,400
Income from Continuing Operations ............................................... 191,226 72,059 151,388
Income (Loss) from Discontinued Operations, Net of Tax ............................... 46,119 60,128 (34,231)
Net Income ................................................................. 237,345 132,187 117,157
Net Income Attributable to Noncontrolling Interests ................................... (480) (74) (7)
Net Income Attributable to Graham Holdings Company ................................ 236,865 132,113 117,150
Redeemable Preferred Stock Dividends ............................................ (855) (895) (917)
Net Income Attributable to Graham Holdings Company Common Stockholders .............. $ 236,010 $ 131,218 $ 116,233
Amounts Attributable to Graham Holdings Company Common Stockholders
Income from continuing operations ............................................... $ 189,891 $ 71,090 $ 150,464
Income (loss) from discontinued operations, net of tax ................................. 46,119 60,128 (34,231)
Net income attributable to Graham Holdings Company common stockholders ............... $ 236,010 $ 131,218 $ 116,233
Per Share Information Attributable to Graham Holdings Company Common Stockholders
Basic income per common share from continuing operations ............................ $ 25.83 $ 9.22 $ 19.03
Basic income (loss) per common share from discontinued operations ...................... 6.27 8.17 (4.33)
Basic net income per common share ............................................. $ 32.10 $ 17.39 $ 14.70
Basic average number of common shares outstanding ................................. 7,238 7,360 7,826
Diluted income per common share from continuing operations ........................... $ 25.78 $ 9.22 $ 19.03
Diluted income (loss) per common share from discontinued operations ..................... 6.27 8.17 (4.33)
Diluted net income per common share ............................................ $ 32.05 $ 17.39 $ 14.70
Diluted average number of common shares outstanding ................................ 7,333 7,404 7,905
See accompanying Notes to Consolidated Financial Statements.
2013 FORM 10-K 55