Washington Post 2013 Annual Report Download - page 69
Download and view the complete annual report
Please find page 69 of the 2013 Washington Post annual report below. You can navigate through the pages in the report by either clicking on the pages listed below, or by using the keyword search tool below to find specific information within the annual report.-
 1
1 -
2
-
3
-
4
-
5
-
6
-
7
-
8
-
9
-
10
-
11
-
12
-
13
-
14
-
15
-
16
-
17
-
18
-
19
-
20
-
21
-
22
-
23
-
24
-
25
-
26
-
27
-
28
-
29
-
30
-
31
-
32
-
33
-
34
-
35
-
36
-
37
-
38
-
39
-
40
-
41
-
42
-
43
-
44
-
45
-
46
-
47
-
48
-
49
-
50
-
51
-
52
-
53
-
54
-
55
-
56
-
57
-
58
-
 59
59 -
 60
60 -
 61
61 -
 62
62 -
 63
63 -
 64
64 -
 65
65 -
 66
66 -
 67
67 -
 68
68 -
 69
69 -
 70
70 -
 71
71 -
 72
72 -
 73
73 -
 74
74 -
 75
75 -
 76
76 -
 77
77 -
 78
78 -
 79
79 -
80
-
81
-
82
-
83
-
84
-
85
-
86
-
87
-
88
-
89
-
90
-
91
-
92
-
93
-
94
-
95
-
96
-
97
-
98
-
99
-
100
-
101
-
102
-
103
-
104
-
105
-
106
-
107
-
108
-
109
-
110
-
111
-
112
 |
 |
The key assumptions used by the Company to determine the fair value
of its franchise agreements as of November 30, 2011, the date of its
last annual quantitative impairment review, were as follows:
• Expected cash flows underlying the Company’s business plans for
the periods 2012 through 2021 were used, with the assumption
that the only assets the unbuilt start-up cable systems possess are
the various franchise agreements. The expected cash flows took
into account the estimated initial capital investment in the system
region’s physical plant and related start-up costs, revenues,
operating margins and growth rates. These cash flows and
growth rates were based on forecasts and long-term business
plans and take into account numerous factors, including historical
experience, anticipated economic conditions, changes in the
cable systems’ cost structures, homes in each region’s service
area, number of subscribers based on penetration of homes
passed by the systems and expected revenues per subscriber.
• Cash flows beyond 2021 were projected to grow at a long-
term growth rate, which the Company estimated by considering
historical market growth trends, anticipated cable system
performance and expected market conditions.
• The Company used a discount rate of 8% to risk adjust the cash
flow projections in determining the estimated fair value.
There is always a possibility that impairment charges could occur
in the future, given changes in the cable market and the U.S.
economic environment, as well as the inherent variability in
projecting future operating performance.
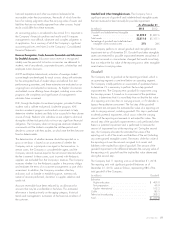
Pension Costs. The Company sponsors a defined benefit pension
plan for eligible employees in the U.S. Excluding curtailment
gain, settlement loss and special termination benefits, the
Company’s net pension cost including amounts for discontinued
operations was $1.9 million and $16.0 million for 2013 and
2012, respectively, and the net pension credit was $4.7 million
for 2011. The Company’s pension benefit obligation and related
costs are actuarially determined and are impacted significantly
by the Company’s assumptions related to future events, including
the discount rate, expected return on plan assets and rate of
compensation increases. The Company evaluates these critical
assumptions at least annually, and periodically evaluates other
assumptions involving demographic factors, such as retirement
age, mortality and turnover, and updates them to reflect its
experience and expectations for the future. Actual results in any
given year will often differ from actuarial assumptions because of
economic and other factors.
The Company assumed a 6.5% expected return on plan assets for
year 2013, which is consistent with the expected return assumption
for years 2012 and 2011. The Company’s actual return on plan
assets was 36.2% in 2013, 18.5% in 2012 and 14.7% in 2011.
The 10-year and 20-year actual returns on plan assets were 10.1%
and 12.7%, respectively.
Accumulated and projected benefit obligations are measured as the
present value of future cash payments. The Company discounts those
cash payments using the weighted average of market-observed
yields for high-quality fixed-income securities with maturities that
correspond to the payment of benefits. Lower discount rates increase
present values and increase subsequent-year pension costs; higher
discount rates decrease present values and decrease subsequent-
year pension costs. The Company’s discount rate at December 31,
2013, 2012 and 2011, was 4.8%, 4.0% and 4.7%, respectively,
reflecting market interest rates.
Changes in key assumptions for the Company’s pension plan would
have the following effects on the 2013 pension cost, excluding
curtailment gain, settlement loss and special termination benefits:
• Expected return on assets—A 1% increase or decrease to the
Company’s assumed expected return on plan assets would have
decreased or increased the pension cost by approximately $16
million.
• Discount rate—A 1% decrease to the Company’s assumed
discount rate would have increased the pension cost by
approximately $17 million. A 1% increase to the Company’s
assumed discount rate would have decreased the pension cost by
approximately $4 million.
The Company’s net pension cost (credit) includes an expected return
on plan assets component, calculated using the expected return on
plan assets assumption applied to a market-related value of plan
assets. The market-related value of plan assets is determined using a
five-year average market value method, which recognizes realized
and unrealized appreciation and depreciation in market values over
a five-year period. The value resulting from applying this method is
adjusted, if necessary, such that it cannot be less than 80% or more
than 120% of the market value of plan assets as of the relevant
measurement date. As a result, year-to-year increases or decreases
in the market-related value of plan assets impact the return on plan
assets component of pension cost (credit) for the year.
At the end of each year, differences between the actual return on
plan assets and the expected return on plan assets are combined
with other differences in actual versus expected experience to form
a net unamortized actuarial gain or loss in accumulated other
comprehensive income. Only those net actuarial gains or losses in
excess of the deferred realized and unrealized appreciation and
depreciation are potentially subject to amortization.
The types of items that generate actuarial gains and losses that may
be subject to amortization in net periodic pension cost (credit)
include the following:
• Asset returns that are more or less than the expected return on
plan assets for the year;
• Actual participant demographic experience different from
assumed (retirements, terminations and deaths during the year);
• Actual salary increases different from assumed; and
• Any changes in assumptions that are made to better reflect
anticipated experience of the plan or to reflect current market
conditions on the measurement date (discount rate, longevity
increases, changes in expected participant behavior and
expected return on plan assets).
Amortization of the unrecognized actuarial gain or loss is included
as a component of expense for a year if the magnitude of the net
unamortized gain or loss in accumulated other comprehensive
income exceeds 10% of the greater of the benefit obligation or the
2013 FORM 10-K 51