Washington Post 2013 Annual Report Download - page 107
Download and view the complete annual report
Please find page 107 of the 2013 Washington Post annual report below. You can navigate through the pages in the report by either clicking on the pages listed below, or by using the keyword search tool below to find specific information within the annual report.-
 1
1 -
2
-
3
-
4
-
5
-
6
-
7
-
8
-
9
-
10
-
11
-
12
-
13
-
14
-
15
-
16
-
17
-
18
-
19
-
20
-
21
-
22
-
23
-
24
-
25
-
26
-
27
-
28
-
29
-
30
-
31
-
32
-
33
-
34
-
35
-
36
-
37
-
38
-
39
-
40
-
41
-
42
-
43
-
44
-
45
-
46
-
47
-
48
-
49
-
50
-
51
-
52
-
53
-
54
-
55
-
56
-
57
-
58
-
59
-
60
-
61
-
62
-
63
-
64
-
65
-
66
-
67
-
68
-
69
-
70
-
71
-
72
-
73
-
74
-
75
-
76
-
77
-
78
-
79
-
80
-
81
-
82
-
83
-
84
-
85
-
86
-
87
-
88
-
89
-
90
-
91
-
92
-
93
-
94
-
95
-
96
-
 97
97 -
 98
98 -
 99
99 -
 100
100 -
 101
101 -
 102
102 -
 103
103 -
 104
104 -
 105
105 -
 106
106 -
 107
107 -
 108
108 -
 109
109 -
 110
110 -
 111
111 -
 112
112
 |
 |

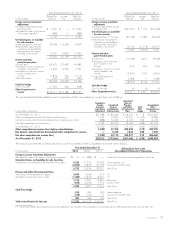
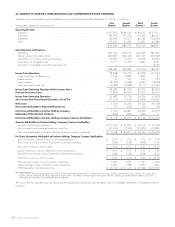
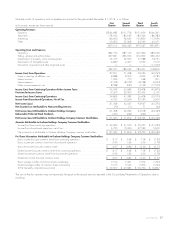
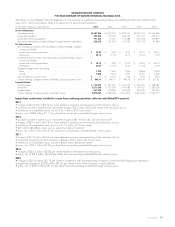
GRAHAM HOLDINGS COMPANY
FIVE-YEAR SUMMARY OF SELECTED HISTORICAL FINANCIAL DATA
See Notes to Consolidated Financial Statements for the summary of significant accounting policies and additional information relative to the
years 2011–2013 and refer to Note 3 for discussion of discontinued operations.
(in thousands, except per share amounts) 2013 2012 2011 2010 2009
Results of Operations
Operating revenues ................................................ $3,487,864 $3,455,570 $3,525,997 $3,935,725 $3,563,349
Income from operations ............................................. 345,565 179,180 334,118 601,577 453,010
Income from continuing operations ..................................... 191,226 72,059 151,388 354,933 263,819
Net income attributable to Graham Holdings Company common stockholders ..... 236,010 131,218 116,233 277,192 91,846
Per Share Amounts
Basic earnings per common share attributable to Graham Holdings Company
common stockholders
Income from continuing operations ................................... $ 25.83 $ 9.22 $ 19.03 $ 39.67 $ 28.15
Net income .................................................... 32.10 17.39 14.70 31.06 9.78
Diluted earnings per common share attributable to Graham Holdings Company
common stockholders
Income from continuing operations ................................... $ 25.78 $ 9.22 $ 19.03 $ 39.65 $ 28.15
Net income .................................................... 32.05 17.39 14.70 31.04 9.78
Weighted average shares outstanding:
Basic ........................................................ 7,238 7,360 7,826 8,869 9,332
Diluted ....................................................... 7,333 7,404 7,905 8,931 9,392
Cash dividends per common share .................................... $—$ 19.60 $ 9.40 $ 9.00 $ 8.60
Graham Holdings Company common stockholders’ equity per common share ..... $ 446.73 $ 348.17 $ 342.76 $ 343.47 $ 317.21
Financial Position
Working capital .................................................. $ 768,278 $ 327,476 $ 250,069 $ 353,621 $ 398,481
Total assets ...................................................... 5,811,046 5,105,069 5,016,986 5,158,367 5,186,206
Long-term debt ................................................... 447,608 453,384 452,229 396,650 396,236
Graham Holdings Company common stockholders’ equity ................... 3,300,067 2,586,028 2,601,896 2,814,364 2,939,550
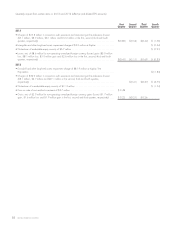
Impact from certain items included in income from continuing operations (after-tax and diluted EPS amounts):
2013
• charges of $25.3 million ($3.46 per share) related to severance and restructuring at the education division
• goodwill and other long-lived assets impairment charge of $3.2 million ($0.44 per share) at the education division
• write-down of a marketable equity security of $6.7 million ($0.91 per share)
• losses, net, of $8.6 million ($1.17 per share) from non-operating unrealized foreign currency losses
2012
• goodwill and other long-lived assets impairment charge of $81.9 million ($11.33 per share) at KTP
• charges of $32.9 million ($4.53 per share) related to severance and restructuring at the education division
• write-down of a marketable equity security of $11.2 million ($1.54 per share)
• $3.7 million ($0.48 per share) gain on sale of cost method investment
• gains, net, of $2.0 million ($0.27 per share) from non-operating unrealized foreign currency gains
2011
• charges of $17.9 million ($2.26 per share) related to severance and restructuring at the education division
• impairment charge at one of the Company’s affiliates of $5.7 million ($0.72 per share)
• write-down of a marketable equity security of $34.6 million ($4.34 per share)
• losses, net, of $2.1 million ($0.26 per share) from non-operating unrealized foreign currency losses
2010
• charges of $24.2 million ($2.83 per share) related to severance and restructuring
• gains, net, of $4.2 million ($0.47 per share) from non-operating unrealized foreign currency gains
2009
• charges of $20.6 million ($2.19 per share) in connection with the restructuring of Kaplan’s Score and Test Preparation operations
• impairment charges of $18.8 million ($2.00 per share) at two of the Company’s equity affiliates
• gains, net, of $10.3 million ($1.10 per share) from non-operating unrealized foreign currency gains
2013 FORM 10-K 89