Washington Post 2013 Annual Report Download - page 60
Download and view the complete annual report
Please find page 60 of the 2013 Washington Post annual report below. You can navigate through the pages in the report by either clicking on the pages listed below, or by using the keyword search tool below to find specific information within the annual report.-
 1
1 -
2
-
3
-
4
-
5
-
6
-
7
-
8
-
9
-
10
-
11
-
12
-
13
-
14
-
15
-
16
-
17
-
18
-
19
-
20
-
21
-
22
-
23
-
24
-
25
-
26
-
27
-
28
-
29
-
30
-
31
-
32
-
33
-
34
-
35
-
36
-
37
-
38
-
39
-
40
-
41
-
42
-
43
-
44
-
45
-
46
-
47
-
48
-
49
-
 50
50 -
 51
51 -
 52
52 -
 53
53 -
 54
54 -
 55
55 -
 56
56 -
 57
57 -
 58
58 -
 59
59 -
 60
60 -
 61
61 -
 62
62 -
 63
63 -
 64
64 -
 65
65 -
 66
66 -
 67
67 -
 68
68 -
 69
69 -
 70
70 -
71
-
72
-
73
-
74
-
75
-
76
-
77
-
78
-
79
-
80
-
81
-
82
-
83
-
84
-
85
-
86
-
87
-
88
-
89
-
90
-
91
-
92
-
93
-
94
-
95
-
96
-
97
-
98
-
99
-
100
-
101
-
102
-
103
-
104
-
105
-
106
-
107
-
108
-
109
-
110
-
111
-
112
 |
 |

part of the Company’s 2012 annual goodwill and intangible assets
impairment testing.
Kaplan International includes English-language programs and
postsecondary education and professional training businesses
largely outside the United States. Kaplan International revenue
increased 6% in 2013 due to enrollment growth in the pathways,
English-language and Singapore higher education programs.
Kaplan International operating income increased in 2013 due
largely to a reduction in operating losses in Australia from lower
restructuring costs, and improved results in Singapore. These
increases were offset by reduced earnings in professional training
and increased investment to support growth in English-language
programs. Restructuring costs at Kaplan International totaled
$5.8 million and $16.4 million in 2013 and 2012, respectively.
These restructuring costs were largely in Australia and included lease
obligations, accelerated depreciation and severance charges; the
restructuring plan in Australia has now been completed.
In 2013, Kaplan recorded $3.3 million in noncash intangible and
other long-lived assets impairment charges primarily in connection
with one of the businesses in Kaplan International.
Kaplan corporate represents unallocated expenses of Kaplan, Inc.’s
corporate office, other minor businesses and certain shared activities. In
2013, $11.0 million in restructuring costs was recorded in connection
with charges related to office space managed by Kaplan corporate.
In 2012, $2.6 million in restructuring costs was included in amorti-
zation of intangible assets, largely from accelerated intangible asset
amortization associated with changes to business operations in
Australia.
Cable Division. Cable division revenue for 2013 increased 3% to
$807.3 million, from $787.1 million in 2012. The revenue
increase in 2013 is due to recent rate increases for a substantial
portion of subscribers, growth in commercial sales and a reduction
in promotional discounts. The increase was offset by a decline in
video subscribers, as the cable division focuses its efforts on churn
reduction and retention of its high-value subscribers.
Cable division operating income in 2013 increased 10% to $169.7
million, from $154.6 million in 2012, due primarily to increased
revenues, partially offset by higher programming costs. Operating
margin at the cable division was 21% in 2013 and 20% in 2012.
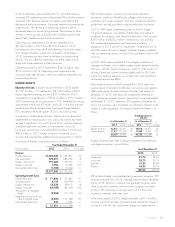
At December 31, 2013, Primary Service Units (PSUs) were down
4% from the prior year due primarily to a decline in video
subscribers. A summary of PSUs is as follows:
As of December 31
2013 2012
Video .......................... 538,894 593,615
High-speed data .................. 472,631 459,235
Telephony ....................... 177,483 184,528
Total ......................... 1,189,008 1,237,378
PSUs include about 6,300 subscribers who receive free basic cable
service, primarily local governments, schools and other organizations
as required by various franchise agreements.
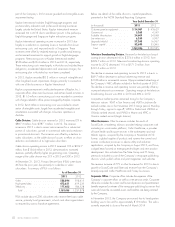
Below are details of the cable division’s capital expenditures,
presented in the NCTA Standard Reporting Categories:
Year Ended December 31
(in thousands) 2013 2012
Customer premise equipment ....... $ 34,087 $ 43,629
Commercial ................... 5,265 4,549
Scalable infrastructure ............ 24,609 24,048
Line extensions ................. 6,350 5,997
Upgrade/rebuild ............... 37,245 16,957
Support capital ................. 52,690 55,345
Total ....................... $160,246 $150,525
Television Broadcasting Division. Revenue for the television broad-
casting division decreased 6% to $374.6 million in 2013, from
$399.7 million in 2012. Television broadcasting division operating
income for 2013 decreased 11% to $171.3 million, from
$191.6 million in 2012.
The decline in revenue and operating income for 2013 is due to a
$49.7 million decrease in political advertising revenue and
$10.8 million in incremental summer Olympics-related advertising at
the Company’s NBC affiliates included in the third quarter of 2012.
The decline in revenue and operating income was partially offset by
increased retransmission revenues. Operating margin at the television
broadcasting division was 46% in 2013 and 48% in 2012.
Competitive market position remained strong for the Company’s
television stations. KSAT in San Antonio and WJXT in Jacksonville
ranked number one in the November 2013 ratings period, Monday
through Friday, sign-on to sign-off; WDIV in Detroit and WKMG in
Orlando ranked second, and WPLG in Miami and KPRC in
Houston ranked second (Anglo stations).
Other Businesses. Otherbusinessesincludestheresultsof
SocialCode, a marketing solutions provider helping companies with
marketing on social-media platforms; Celtic Healthcare, a provider
of home health and hospice services in the northeastern and mid-
Atlantic regions, acquired by the Company in November 2012;
Forney, a global supplier of products and systems that control and
monitor combustion processes in electric utility and industrial
applications, acquired by the Company in August 2013; and Trove,
a digital team focused on emerging technologies and new product
development. Also included are The Slate Group and FP Group,
previously included as part of the Company’s newspaper publishing
division, which publish online and print magazines and websites.
The revenue increase of 77% in other businesses for 2013 is due to
growth at SocialCode and Slate and revenue from the Company’s
recently acquired Celtic Healthcare and Forney businesses.
Corporate Office. Corporate office includes the expenses of the
Company’s corporate office, as well as a net pension credit. Corporate
office also includes the current and historical pension and postretirement
benefits expense for retirees of the newspaper publishing businesses that
were sold since the associated assets and liabilities are being retained
by the Company.
In November 2013, the Company announced that its headquarters
building was to be sold for approximately $159 million. The sale is
currently expected to close at the end of March 2014.
42 GRAHAM HOLDINGS COMPANY