Washington Post 2013 Annual Report Download - page 59
Download and view the complete annual report
Please find page 59 of the 2013 Washington Post annual report below. You can navigate through the pages in the report by either clicking on the pages listed below, or by using the keyword search tool below to find specific information within the annual report.-
 1
1 -
2
-
3
-
4
-
5
-
6
-
7
-
8
-
9
-
10
-
11
-
12
-
13
-
14
-
15
-
16
-
17
-
18
-
19
-
20
-
21
-
22
-
23
-
24
-
25
-
26
-
27
-
28
-
29
-
30
-
31
-
32
-
33
-
34
-
35
-
36
-
37
-
38
-
39
-
40
-
41
-
42
-
43
-
44
-
45
-
46
-
47
-
48
-
 49
49 -
 50
50 -
 51
51 -
 52
52 -
 53
53 -
 54
54 -
 55
55 -
 56
56 -
 57
57 -
 58
58 -
 59
59 -
 60
60 -
 61
61 -
 62
62 -
 63
63 -
 64
64 -
 65
65 -
 66
66 -
 67
67 -
 68
68 -
 69
69 -
70
-
71
-
72
-
73
-
74
-
75
-
76
-
77
-
78
-
79
-
80
-
81
-
82
-
83
-
84
-
85
-
86
-
87
-
88
-
89
-
90
-
91
-
92
-
93
-
94
-
95
-
96
-
97
-
98
-
99
-
100
-
101
-
102
-
103
-
104
-
105
-
106
-
107
-
108
-
109
-
110
-
111
-
112
 |
 |

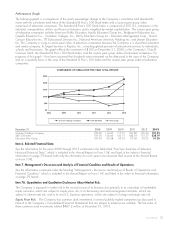
In 2013, education revenue decreased 1%, subscriber revenue
increased 3%, advertising revenue decreased 9% and other revenue
increased 50%. Revenue declines at Kaplan accounted for the
decrease in education revenue. Subscriber revenue increased at the
cable division. The decrease in advertising revenue is due to
decreased television broadcasting revenue. The increase in other
revenue is due to growth at SocialCode and Slate, and from the
recent Celtic Healthcare and Forney acquisitions.
Operating costs and expenses for the year declined 4% to
$3,142.3 million in 2013, from $3,276.4 million in 2012.
Excluding the noncash goodwill and other-long lived assets impair-
ment charge at Kaplan, overall costs at Kaplan still declined in
2013, and expenses were lower at the television broadcasting
division. This was offset by increased costs at the cable division,
along with higher expenses in other businesses.
Operating income for 2013 increased to $345.6 million, from
$179.2 million in 2012. Operating results improved at the
education and cable divisions, offset by a decline at the television
broadcasting division.
DIVISION RESULTS
Education Division. Education division revenue in 2013 totaled
$2,177.5 million, a 1% decline from $2,196.5 million in 2012.
Kaplan reported operating income of $51.3 million for 2013,
compared to an operating loss of $105.4 million in 2012. Kaplan’s
2013 operating results in comparison to 2012 benefited from strong
improvement in KHE and KTP results, and a $111.6 million noncash
goodwill and other long-lived assets impairment charge related to
KTP, recorded in the fourth quarter of 2012, that did not recur.
In response to student demand levels, Kaplan has formulated and
implemented restructuring plans at its various businesses that have
resulted in significant costs in 2013 and 2012, with the objective
of establishing lower cost levels in future periods. Across all
businesses, restructuring costs totaled $36.4 million in 2013 and
$45.2 million in 2012. Kaplan continues to evaluate its cost
structure and may develop additional restructuring plans in 2014.
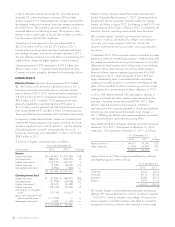
A summary of Kaplan’s operating results is as follows:
Year Ended December 31
(in thousands) 2013 2012 % Change
Revenue
Higher education ......... $1,080,908 $1,149,407 (6)
Test preparation .......... 293,201 284,252 3
Kaplan international ....... 797,362 753,790 6
Kaplan corporate ......... 7,990 15,039 (47)
Intersegment elimination .... (1,953) (5,992) —
$2,177,508 $2,196,496 (1)
Operating Income (Loss)
Higher education ......... $ 71,584 $ 27,245 —
Test preparation .......... 4,118 (10,799) —
Kaplan international ....... 53,424 49,612 8
Kaplan corporate ......... (64,948) (43,160) (50)
Amortization of intangible
assets................ (9,962) (17,719) 44
Impairment of goodwill and
other long-lived assets .... (3,250) (111,593) 97
Intersegment elimination .... 335 1,046 —
$ 51,301 $ (105,368) —
KHE includes Kaplan’s domestic postsecondary education
businesses, made up of fixed-facility colleges and online post-
secondary and career programs. KHE also includes the domestic
professional training and other continuing education businesses.
In 2012, KHE began implementing plans to close or merge
13 ground campuses, consolidate other facilities and reduce its
workforce. In connection with these and other plans, KHE incurred
$19.5 million and $23.4 million in restructuring costs primarily
from accelerated depreciation and severance and lease
obligations in 2013 and 2012, respectively. At the end of 2013,
the KHE campus closures or mergers had been largely completed,
with two remaining campus closures to be completed in the first half
of 2014.
In 2013, KHE revenue declined 6% due largely to declines in
average enrollments, which reflect weaker market demand over the
past year, and the impact of campuses closed or in the process of
closing. Operating income increased significantly for 2013 due
primarily to expense reductions associated with lower enrollments
and recent restructuring efforts.
New student enrollments at KHE increased 4% in 2013 due to the
positive impact of trial period modifications and process improvements,
offset by the impact of campus closures. However, total students at
December 31, 2013, were down 8% compared to December 31,
2012. Excluding campuses closed or planned for closure, total students
at December 31, 2013, were down 5% compared to December 31,
2012. The increase in new enrollments was offset by a reduction in the
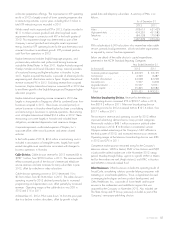
number of continuing students. A summary of student enrollments is as
follows:
Excluding Campuses
Closing
As of December 31 %
Change
As of December 31 %
Change2013 2012 2013 2012
Kaplan University . . . 42,816 44,371 (4) 42,816 44,371 (4)
Other Campuses . . . 17,417 21,099 (17) 17,342 19,267 (10)
60,233 65,470 (8) 60,158 63,638 (5)
Kaplan University and Other Campuses enrollments by certificate
and degree programs, are as follows:
As of December 31
2013 2012
Certificate ........................ 21.7% 23.2%
Associate’s ....................... 29.7% 29.1%
Bachelor’s ........................ 32.3% 33.8%
Master’s ......................... 16.3% 13.9%
100.0% 100.0%
KTP includes Kaplan’s standardized test preparation programs. KTP
revenue increased 3% in 2013. Although total enrollment declined
3% for 2013, declines in revenue from graduate programs were
offset by growth in medical and bar review programs and other
products. KTP operating results improved in 2013 due to the
increase in revenues and lower costs.
In the fourth quarter of 2012, Kaplan recorded a $111.6 million
noncash goodwill and other long-lived assets impairment charge in
connection with KTP. This impairment charge was determined as
2013 FORM 10-K 41