Time Magazine 2015 Annual Report Download - page 74
Download and view the complete annual report
Please find page 74 of the 2015 Time Magazine annual report below. You can navigate through the pages in the report by either clicking on the pages listed below, or by using the keyword search tool below to find specific information within the annual report.-
 1
1 -
2
-
3
-
4
-
5
-
6
-
7
-
8
-
9
-
10
-
11
-
12
-
13
-
14
-
15
-
16
-
17
-
18
-
19
-
20
-
21
-
22
-
23
-
24
-
25
-
26
-
27
-
28
-
29
-
30
-
31
-
32
-
33
-
34
-
35
-
36
-
37
-
38
-
39
-
40
-
41
-
42
-
43
-
44
-
45
-
46
-
47
-
48
-
49
-
50
-
51
-
52
-
53
-
54
-
55
-
56
-
57
-
58
-
59
-
60
-
61
-
62
-
63
-
 64
64 -
 65
65 -
 66
66 -
 67
67 -
 68
68 -
 69
69 -
 70
70 -
 71
71 -
 72
72 -
 73
73 -
 74
74 -
 75
75 -
 76
76 -
 77
77 -
 78
78 -
 79
79 -
 80
80 -
 81
81 -
 82
82 -
 83
83 -
 84
84 -
85
-
86
-
87
-
88
-
89
-
90
-
91
-
92
-
93
-
94
-
95
-
96
-
97
-
98
-
99
-
100
-
101
-
102
-
103
-
104
-
105
-
106
-
107
-
108
-
109
-
110
-
111
-
112
-
113
-
114
-
115
-
116
-
117
-
118
-
119
-
120
-
121
-
122
-
123
-
124
-
125
-
126
-
127
-
128
-
129
-
130
-
131
-
132
-
133
-
134
-
135
-
136
-
137
-
138
-
139
-
140
 |
 |

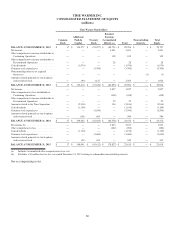
TIME WARNER INC.
CONSOLIDATED STATEMENT OF EQUITY
(millions)
Time Warner Shareholders’
Common
Stock
Additional
Paid-In
Capital
Treasury
Stock
Retained
Earnings
(Accumulated
Deficit) (a) Total
Noncontrolling
Interests
Total
Equity
BALANCE AT DECEMBER 31, 2012 . . $ 17 $ 154,577 $ (35,077) $ (89,721) $ 29,796 $ 1 $ 29,797
Net income .......................... — — — 3,691 3,691 — 3,691
Other comprehensive income attributable to
Continuing Operations ............... — — — 109 109 — 109
Other comprehensive income attributable to
Discontinued Operations ............. — — — 28 28 — 28
Cash dividends ....................... — (1,074) — — (1,074) — (1,074)
Common stock repurchases ............. — — (3,700) — (3,700) — (3,700)
Noncontrolling interests of acquired
businesses ......................... — — — — — (1) (1)
Amounts related primarily to stock options
and restricted stock .................. — (93) 1,147 — 1,054 — 1,054
BALANCE AT DECEMBER 31, 2013 . . $ 17 $ 153,410 $ (37,630) $ (85,893) $ 29,904 $ — $ 29,904
Net income .......................... — — — 3,827 3,827 — 3,827
Other comprehensive loss attributable to
Continuing Operations ............... — — — (438) (438) — (438)
Other comprehensive income attributable to
Discontinued Operations ............. — — — 22 22 — 22
Amounts related to the Time Separation . . . — (2,918) — 104 (2,814) — (2,814)
Cash dividends ....................... — (1,109) — — (1,109) — (1,109)
Common stock repurchases ............. — — (5,500) — (5,500) — (5,500)
Amounts related primarily to stock options
and restricted stock .................. — (101) 685 — 584 — 584
BALANCE AT DECEMBER 31, 2014 . . $ 17 $ 149,282 $ (42,445) $ (82,378) $ 24,476 $ — $ 24,476
Net income (b) ....................... — — — 3,833 3,833 — 3,833
Other comprehensive loss .............. — — — (282) (282) — (282)
Cash dividends ....................... — (1,150) — — (1,150) — (1,150)
Common stock repurchases ............. — — (3,600) — (3,600) — (3,600)
Amounts related primarily to stock options
and restricted stock .................. — (91) 433 — 342 — 342
BALANCE AT DECEMBER 31, 2015 . . $ 17 $ 148,041 $ (45,612) $ (78,827) $ 23,619 $ — $ 23,619
(a) Includes Accumulated other comprehensive loss, net.
(b) Excludes a $1 million loss for the year ended December 31, 2015 relating to redeemable noncontrolling interests.
See accompanying notes.
60