Time Magazine 2015 Annual Report Download - page 56
Download and view the complete annual report
Please find page 56 of the 2015 Time Magazine annual report below. You can navigate through the pages in the report by either clicking on the pages listed below, or by using the keyword search tool below to find specific information within the annual report.-
 1
1 -
2
-
3
-
4
-
5
-
6
-
7
-
8
-
9
-
10
-
11
-
12
-
13
-
14
-
15
-
16
-
17
-
18
-
19
-
20
-
21
-
22
-
23
-
24
-
25
-
26
-
27
-
28
-
29
-
30
-
31
-
32
-
33
-
34
-
35
-
36
-
37
-
38
-
39
-
40
-
41
-
42
-
43
-
44
-
45
-
 46
46 -
 47
47 -
 48
48 -
 49
49 -
 50
50 -
 51
51 -
 52
52 -
 53
53 -
 54
54 -
 55
55 -
 56
56 -
 57
57 -
 58
58 -
 59
59 -
 60
60 -
 61
61 -
 62
62 -
 63
63 -
 64
64 -
 65
65 -
 66
66 -
67
-
68
-
69
-
70
-
71
-
72
-
73
-
74
-
75
-
76
-
77
-
78
-
79
-
80
-
81
-
82
-
83
-
84
-
85
-
86
-
87
-
88
-
89
-
90
-
91
-
92
-
93
-
94
-
95
-
96
-
97
-
98
-
99
-
100
-
101
-
102
-
103
-
104
-
105
-
106
-
107
-
108
-
109
-
110
-
111
-
112
-
113
-
114
-
115
-
116
-
117
-
118
-
119
-
120
-
121
-
122
-
123
-
124
-
125
-
126
-
127
-
128
-
129
-
130
-
131
-
132
-
133
-
134
-
135
-
136
-
137
-
138
-
139
-
140
 |
 |
TIME WARNER INC.
MANAGEMENT’S DISCUSSION AND ANALYSIS
OF RESULTS OF OPERATIONS AND FINANCIAL CONDITION - (Continued)
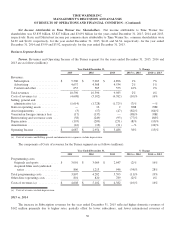
and advertising costs for the year ended December 31, 2015 was primarily due to the mix of product released. Other costs,
including merchandise and related costs increased for the year ended December 31, 2015 primarily due to higher distribution
costs associated with videogame sales.
Selling, general and administrative expenses decreased for the year ended December 31, 2015 primarily due to the
favorable impact of foreign exchange rates of approximately $80 million, lower distribution expenses of $23 million and
lower employee expenses of $18 million, partially offset by higher bad debt expense of $80 million primarily related to
international television operations.
Refer to “Transactions and Other Items Affecting Comparability” for a discussion of Asset impairments, Gain (loss) on
operating assets, Venezuelan foreign currency loss and external costs related to mergers, acquisitions and dispositions for the
years ended December 31, 2015 and 2014, which affected the comparability of the Warner Bros. segment’s results.
The increase in Operating Income for the year ended December 31, 2015 was primarily due to higher revenues, lower
Restructuring and severance costs, lower Selling, general and administrative expenses, lower Asset impairments and lower
Venezuelan foreign currency losses, partially offset by higher Costs of revenues.
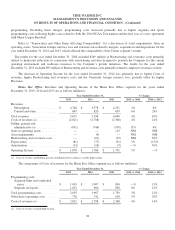
2014 vs. 2013
The increase in Revenues for the year ended December 31, 2014 included the net unfavorable impact of foreign
exchange rates of approximately $100 million.
Theatrical product revenues from film rentals decreased for the year ended December 31, 2014, reflecting lower
revenues of $215 million from theatrical films released during 2014 compared to 2013, partially offset by higher carryover
revenues of $26 million from prior period releases. The Company released 22 and 18 theatrical films in 2014 and 2013,
respectively.
For the year ended December 31, 2014, theatrical product revenues from home video and electronic delivery decreased
due to lower revenues of $127 million from releases during 2014 compared to 2013 and lower revenues of $78 million from
prior period releases, including catalog titles. There were 18 and 17 home video and electronic delivery releases in 2014 and
2013, respectively.
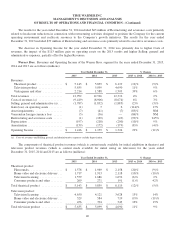
The increase in theatrical product revenues from consumer products and other reflected higher intellectual property
licensing, including theme park licensing of the Harry Potter brands and characters.
Television product revenues from television licensing for the year ended December 31, 2014 increased primarily due to
growth in television production reflecting additional series produced, including series produced by Eyeworks, as well as
higher license fees from SVOD services, primarily internationally.
The decrease in television product revenues from home video and electronic delivery for the year ended December 31,
2014 was primarily due to continued declines in sales of home entertainment product in physical formats.
Television product revenues from consumer products and other increased for the year ended December 31, 2014
primarily due to an increase in Warner Bros.’ share of revenues from television series produced by third parties as well as an
increase in the production of television series by Warner Bros. on behalf of third parties.
Videogames and other revenues increased for the year ended December 31, 2014 primarily due to $75 million of
revenues from a patent license and settlement agreement.
Included in film and television production costs are production costs related to videogames, as well as theatrical film
and videogame valuation adjustments resulting primarily from revisions to estimates of ultimate revenue and/or costs for
42