Time Magazine 2015 Annual Report Download - page 53
Download and view the complete annual report
Please find page 53 of the 2015 Time Magazine annual report below. You can navigate through the pages in the report by either clicking on the pages listed below, or by using the keyword search tool below to find specific information within the annual report.-
 1
1 -
2
-
3
-
4
-
5
-
6
-
7
-
8
-
9
-
10
-
11
-
12
-
13
-
14
-
15
-
16
-
17
-
18
-
19
-
20
-
21
-
22
-
23
-
24
-
25
-
26
-
27
-
28
-
29
-
30
-
31
-
32
-
33
-
34
-
35
-
36
-
37
-
38
-
39
-
40
-
41
-
42
-
 43
43 -
 44
44 -
 45
45 -
 46
46 -
 47
47 -
 48
48 -
 49
49 -
 50
50 -
 51
51 -
 52
52 -
 53
53 -
 54
54 -
 55
55 -
 56
56 -
 57
57 -
 58
58 -
 59
59 -
 60
60 -
 61
61 -
 62
62 -
 63
63 -
64
-
65
-
66
-
67
-
68
-
69
-
70
-
71
-
72
-
73
-
74
-
75
-
76
-
77
-
78
-
79
-
80
-
81
-
82
-
83
-
84
-
85
-
86
-
87
-
88
-
89
-
90
-
91
-
92
-
93
-
94
-
95
-
96
-
97
-
98
-
99
-
100
-
101
-
102
-
103
-
104
-
105
-
106
-
107
-
108
-
109
-
110
-
111
-
112
-
113
-
114
-
115
-
116
-
117
-
118
-
119
-
120
-
121
-
122
-
123
-
124
-
125
-
126
-
127
-
128
-
129
-
130
-
131
-
132
-
133
-
134
-
135
-
136
-
137
-
138
-
139
-
140
 |
 |
TIME WARNER INC.
MANAGEMENT’S DISCUSSION AND ANALYSIS
OF RESULTS OF OPERATIONS AND FINANCIAL CONDITION - (Continued)
2015 vs. 2014
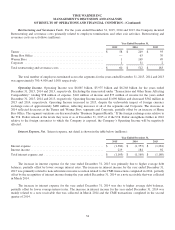
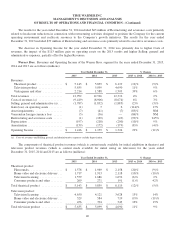
The increase in Subscription revenues for the year ended December 31, 2015 was primarily due to higher domestic
subscription revenues of $195 million driven mainly by higher contractual rates. International subscription revenues for the
year ended December 31, 2015 decreased $25 million mainly due to the transfer to Turner of the operation and certain
contracts of an HBO-branded basic tier television service in India and the unfavorable impact of foreign exchange rates of
approximately $15 million, partially offset by growth from international subscribers.
The increase in Content and other revenues for the year ended December 31, 2015 was primarily due to higher
television licensing revenues from original programming of $91 million, which included the negative impact of foreign
exchange rates of approximately $15 million, partially offset by lower home entertainment revenues of $62 million.
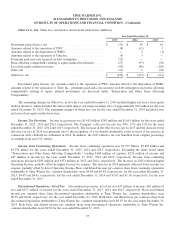
The increase in Costs of revenues for the year ended December 31, 2015 reflected higher originals and sports
programming costs and higher other direct operating costs. The increase in originals and sports programming costs for the
year ended December 31, 2015 was primarily due to higher programming impairments and higher costs for original series.
The increase in other direct operating costs for the year ended December 31, 2015 was mainly due to costs associated with
HBO NOW.
For the year ended December 31, 2015, Selling, general and administrative expenses increased primarily due to higher
marketing expenses related to HBO NOW.
Refer to “Transactions and Other Items Affecting Comparability” for a discussion of Asset impairments for the year
ended December 31, 2014, which affected the comparability of the Home Box Office segment’s results.
The increase in Operating Income for the year ended December 31, 2015 was primarily due to higher revenues and
lower Restructuring and severance costs, partially offset by higher Costs of revenues and Selling, general and administrative
expenses.
2014 vs. 2013
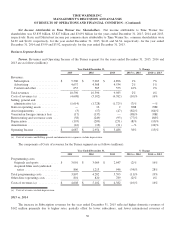
The increase in Subscription revenues for the year ended December 31, 2014 was primarily due to higher domestic
subscription revenues of $198 million driven mainly by higher contractual rates and higher revenues of $146 million at HBO
Asia and HBO Nordic primarily due to their consolidations in September 2013 and June 2013, respectively.
The increase in Content and other revenues for the year ended December 31, 2014 was primarily due to higher
worldwide licensing revenues from original programming of $116 million, primarily relating to the licensing of select
original programming to an SVOD service, and higher home entertainment revenues of $71 million.
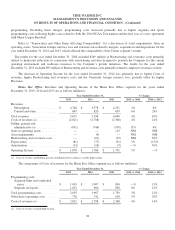
The increase in Costs of revenues for the year ended December 31, 2014 reflected higher programming and other direct
operating costs. The increase in programming costs for the year ended December 31, 2014 was primarily due to higher
acquired films and syndicated series programming costs, which included the consolidations of both HBO Asia and HBO
Nordic, as well as higher originals and sports programming costs, reflecting higher costs for original series. The increase in
other direct operating costs for the year ended December 31, 2014 was mainly due to higher participation expenses and the
absence of a $31 million reduction to a receivable allowance recorded in 2013.
For the year ended December 31, 2014, Selling, general and administrative expenses increased due to higher expenses
of $36 million at HBO Asia and HBO Nordic primarily due to their consolidations in 2013.
Refer to “Transactions and Other Items Affecting Comparability” for a discussion of Asset impairments and Gain
(loss) on operating assets for the years ended December 31, 2014 and 2013, which affected the comparability of the Home
Box Office segment’s results.
39