Time Magazine 2015 Annual Report Download - page 50
Download and view the complete annual report
Please find page 50 of the 2015 Time Magazine annual report below. You can navigate through the pages in the report by either clicking on the pages listed below, or by using the keyword search tool below to find specific information within the annual report.-
 1
1 -
2
-
3
-
4
-
5
-
6
-
7
-
8
-
9
-
10
-
11
-
12
-
13
-
14
-
15
-
16
-
17
-
18
-
19
-
20
-
21
-
22
-
23
-
24
-
25
-
26
-
27
-
28
-
29
-
30
-
31
-
32
-
33
-
34
-
35
-
36
-
37
-
38
-
39
-
 40
40 -
 41
41 -
 42
42 -
 43
43 -
 44
44 -
 45
45 -
 46
46 -
 47
47 -
 48
48 -
 49
49 -
 50
50 -
 51
51 -
 52
52 -
 53
53 -
 54
54 -
 55
55 -
 56
56 -
 57
57 -
 58
58 -
 59
59 -
 60
60 -
61
-
62
-
63
-
64
-
65
-
66
-
67
-
68
-
69
-
70
-
71
-
72
-
73
-
74
-
75
-
76
-
77
-
78
-
79
-
80
-
81
-
82
-
83
-
84
-
85
-
86
-
87
-
88
-
89
-
90
-
91
-
92
-
93
-
94
-
95
-
96
-
97
-
98
-
99
-
100
-
101
-
102
-
103
-
104
-
105
-
106
-
107
-
108
-
109
-
110
-
111
-
112
-
113
-
114
-
115
-
116
-
117
-
118
-
119
-
120
-
121
-
122
-
123
-
124
-
125
-
126
-
127
-
128
-
129
-
130
-
131
-
132
-
133
-
134
-
135
-
136
-
137
-
138
-
139
-
140
 |
 |

TIME WARNER INC.
MANAGEMENT’S DISCUSSION AND ANALYSIS
OF RESULTS OF OPERATIONS AND FINANCIAL CONDITION - (Continued)
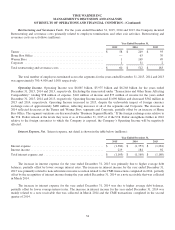
Net Income Attributable to Time Warner Inc. Shareholders. Net income attributable to Time Warner Inc.
shareholders was $3.833 billion, $3.827 billion and $3.691 billion for the years ended December 31, 2015, 2014 and 2013,
respectively. Basic and Diluted net income per common share attributable to Time Warner Inc. common shareholders were
$4.69 and $4.62, respectively, for the year ended December 31, 2015, $4.42 and $4.34, respectively, for the year ended
December 31, 2014 and $3.99 and $3.92, respectively, for the year ended December 31, 2013.
Business Segment Results
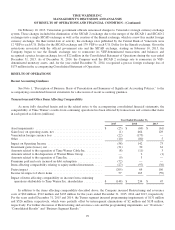
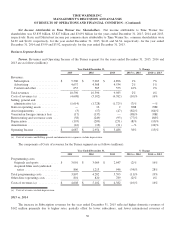
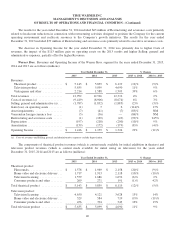
Turner. Revenues and Operating Income of the Turner segment for the years ended December 31, 2015, 2014 and
2013 are as follows (millions):
Year Ended December 31, % Change
2015 2014 2013 2015 vs. 2014 2014 vs. 2013
Revenues:
Subscription .................. $ 5,306 $ 5,263 $ 4,896 1% 7%
Advertising ................... 4,637 4,568 4,534 2% 1%
Content and other .............. 653 565 553 16% 2%
Total revenues .................. 10,596 10,396 9,983 2% 4%
Costs of revenues (a) ............. (4,608) (5,102) (4,382) (10)% 16%
Selling, general and
administrative (a) .............. (1,614) (1,728) (1,725) (7)% —%
Gain on operating assets ........... — 16 2 NM NM
Asset impairments ............... (3) (17) (47) (82)% (64)%
Venezuelan foreign currency loss . . . (17) (137) — (88)% NM
Restructuring and severance costs . . . (58) (249) (93) (77)% 168%
Depreciation .................... (193) (209) (231) (8)% (10)%
Amortization .................... (16) (16) (21) —% (24)%
Operating Income ................ $ 4,087 $ 2,954 $ 3,486 38% (15)%
(a) Costs of revenues and Selling, general and administrative expenses exclude depreciation.
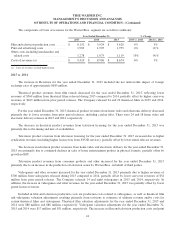
The components of Costs of revenues for the Turner segment are as follows (millions):
Year Ended December 31, % Change
2015 2014 2013 2015 vs. 2014 2014 vs. 2013
Programming costs:
Originals and sports ............ $ 3,001 $ 3,069 $ 2,647 (2)% 16%
Acquired films and syndicated
series ...................... 806 1,213 946 (34)% 28%
Total programming costs .......... 3,807 4,282 3,593 (11)% 19%
Other direct operating costs ........ 801 820 789 (2)% 4%
Costs of revenues (a) ............. $ 4,608 $ 5,102 $ 4,382 (10)% 16%
(a) Costs of revenues exclude depreciation.
2015 vs. 2014
The increase in Subscription revenues for the year ended December 31, 2015 reflected higher domestic revenues of
$142 million primarily due to higher rates, partially offset by lower subscribers, and lower international revenues of
36