Time Magazine 2015 Annual Report Download - page 52
Download and view the complete annual report
Please find page 52 of the 2015 Time Magazine annual report below. You can navigate through the pages in the report by either clicking on the pages listed below, or by using the keyword search tool below to find specific information within the annual report.-
 1
1 -
2
-
3
-
4
-
5
-
6
-
7
-
8
-
9
-
10
-
11
-
12
-
13
-
14
-
15
-
16
-
17
-
18
-
19
-
20
-
21
-
22
-
23
-
24
-
25
-
26
-
27
-
28
-
29
-
30
-
31
-
32
-
33
-
34
-
35
-
36
-
37
-
38
-
39
-
40
-
41
-
 42
42 -
 43
43 -
 44
44 -
 45
45 -
 46
46 -
 47
47 -
 48
48 -
 49
49 -
 50
50 -
 51
51 -
 52
52 -
 53
53 -
 54
54 -
 55
55 -
 56
56 -
 57
57 -
 58
58 -
 59
59 -
 60
60 -
 61
61 -
 62
62 -
63
-
64
-
65
-
66
-
67
-
68
-
69
-
70
-
71
-
72
-
73
-
74
-
75
-
76
-
77
-
78
-
79
-
80
-
81
-
82
-
83
-
84
-
85
-
86
-
87
-
88
-
89
-
90
-
91
-
92
-
93
-
94
-
95
-
96
-
97
-
98
-
99
-
100
-
101
-
102
-
103
-
104
-
105
-
106
-
107
-
108
-
109
-
110
-
111
-
112
-
113
-
114
-
115
-
116
-
117
-
118
-
119
-
120
-
121
-
122
-
123
-
124
-
125
-
126
-
127
-
128
-
129
-
130
-
131
-
132
-
133
-
134
-
135
-
136
-
137
-
138
-
139
-
140
 |
 |

TIME WARNER INC.
MANAGEMENT’S DISCUSSION AND ANALYSIS
OF RESULTS OF OPERATIONS AND FINANCIAL CONDITION - (Continued)
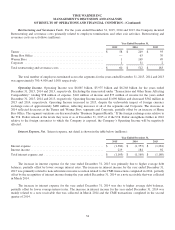
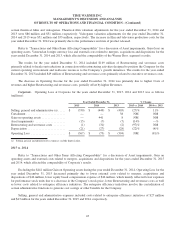
programming. Excluding these charges, programming costs increased primarily due to higher originals and sports
programming costs reflecting higher costs related to both the 2014 NCAA Tournament and the first year of a new agreement
with Major League Baseball.
Refer to “Transactions and Other Items Affecting Comparability” for a discussion of Asset impairments, Gain on
operating assets, Venezuelan foreign currency loss and external costs related to mergers, acquisitions and dispositions for the
year ended December 31, 2014 and 2013, which affected the comparability of the Turner segment’s results.
The results for the year ended December 31, 2014 included $249 million of Restructuring and severance costs primarily
related to headcount reductions in connection with restructuring activities designed to position the Company for the current
operating environment and reallocate resources to the Company’s growth initiatives. The results for the year ended
December 31, 2013 included $93 million of Restructuring and severance costs primarily related to employee severance actions.
The decrease in Operating Income for the year ended December 31, 2014 was primarily due to higher Costs of
revenues, higher Restructuring and severance costs and the Venezuela foreign currency loss, partially offset by higher
Revenues.
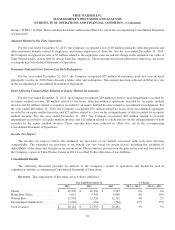
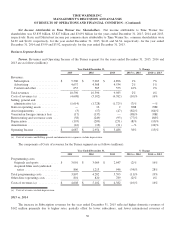
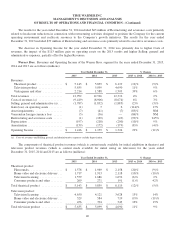
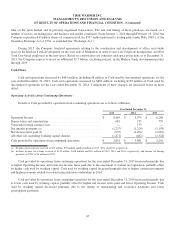
Home Box Office. Revenues and Operating Income of the Home Box Office segment for the years ended
December 31, 2015, 2014 and 2013 are as follows (millions):
Year Ended December 31, % Change
2015 2014 2013 2015 vs. 2014 2014 vs. 2013
Revenues:
Subscription ................. $ 4,748 $ 4,578 $ 4,231 4% 8%
Content and other ............. 867 820 659 6% 24%
Total revenues ................. 5,615 5,398 4,890 4% 10%
Costs of revenues (a) ............ (2,811) (2,708) (2,368) 4% 14%
Selling, general and
administrative (a) ............. (831) (746) (705) 11% 6%
Gain on operating assets .......... — — 113 NM NM
Asset impairments .............. — (4) — NM NM
Restructuring and severance costs . . — (63) (39) NM 62%
Depreciation ................... (81) (77) (91) 5% (15)%
Amortization ................... (14) (14) (9) —% 56%
Operating Income ............... $ 1,878 $ 1,786 $ 1,791 5% —%
(a) Costs of revenues and Selling, general and administrative expenses exclude depreciation.
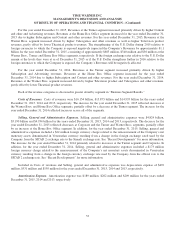
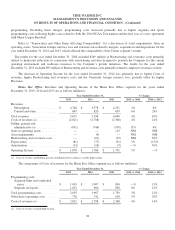
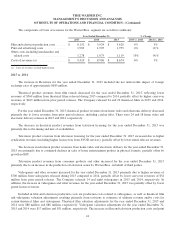
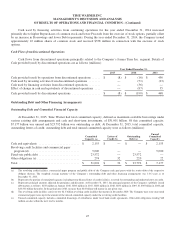
The components of Costs of revenues for the Home Box Office segment are as follows (millions):
Year Ended December 31, % Change
2015 2014 2013 2015 vs. 2014 2014 vs. 2013
Programming costs:
Acquired films and syndicated
series ..................... $ 1,003 $ 1,007 $ 894 —% 13%
Originals and sports ........... 1,032 960 856 8% 12%
Total programming costs ......... 2,035 1,967 1,750 3% 12%
Other direct operating costs ....... 776 741 618 5% 20%
Costs of revenues (a) ............ $ 2,811 $ 2,708 $ 2,368 4% 14%
(a) Costs of revenues exclude depreciation.
38