Time Magazine 2015 Annual Report Download - page 49
Download and view the complete annual report
Please find page 49 of the 2015 Time Magazine annual report below. You can navigate through the pages in the report by either clicking on the pages listed below, or by using the keyword search tool below to find specific information within the annual report.-
 1
1 -
2
-
3
-
4
-
5
-
6
-
7
-
8
-
9
-
10
-
11
-
12
-
13
-
14
-
15
-
16
-
17
-
18
-
19
-
20
-
21
-
22
-
23
-
24
-
25
-
26
-
27
-
28
-
29
-
30
-
31
-
32
-
33
-
34
-
35
-
36
-
37
-
38
-
 39
39 -
 40
40 -
 41
41 -
 42
42 -
 43
43 -
 44
44 -
 45
45 -
 46
46 -
 47
47 -
 48
48 -
 49
49 -
 50
50 -
 51
51 -
 52
52 -
 53
53 -
 54
54 -
 55
55 -
 56
56 -
 57
57 -
 58
58 -
 59
59 -
60
-
61
-
62
-
63
-
64
-
65
-
66
-
67
-
68
-
69
-
70
-
71
-
72
-
73
-
74
-
75
-
76
-
77
-
78
-
79
-
80
-
81
-
82
-
83
-
84
-
85
-
86
-
87
-
88
-
89
-
90
-
91
-
92
-
93
-
94
-
95
-
96
-
97
-
98
-
99
-
100
-
101
-
102
-
103
-
104
-
105
-
106
-
107
-
108
-
109
-
110
-
111
-
112
-
113
-
114
-
115
-
116
-
117
-
118
-
119
-
120
-
121
-
122
-
123
-
124
-
125
-
126
-
127
-
128
-
129
-
130
-
131
-
132
-
133
-
134
-
135
-
136
-
137
-
138
-
139
-
140
 |
 |

TIME WARNER INC.
MANAGEMENT’S DISCUSSION AND ANALYSIS
OF RESULTS OF OPERATIONS AND FINANCIAL CONDITION - (Continued)
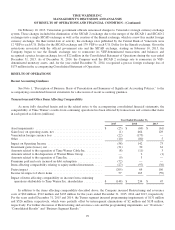
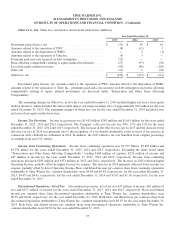
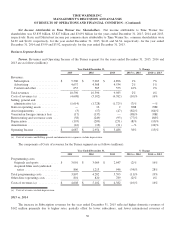
Other Loss, Net. Other loss, net detail is shown in the table below (millions):
Year Ended December 31,
2015 2014 2013
Investment gains (losses), net .................................... $ (31) $ 30 $ 61
Amounts related to the separation of TWC .......................... (8) (11) 3
Amounts related to the disposition of WMG ......................... — 2 (1)
Amounts related to the separation of Time Inc. ....................... (9) 3 —
Premiums paid and costs incurred on debt redemption ................. (72) — —
Items affecting comparability relating to equity method investments ...... (27) (97) (30)
Loss from equity method investees ................................ (96) (56) (120)
Other, net .................................................... (13) 2 (24)
Other loss, net ................................................ $ (256) $ (127) $ (111)
Investment gains (losses), net, amounts related to the separation of TWC, amounts related to the disposition of WMG,
amounts related to the separation of Time Inc., premiums paid and costs incurred on debt redemption and items affecting
comparability relating to equity method investments are discussed under “Transactions and Other Items Affecting
Comparability.”
The remaining changes in Other loss, net for the year ended December 31, 2015 included higher net losses from equity
method investees, which included the unfavorable impact of foreign exchange rates of approximately $70 million for the year
ended December 31, 2015. The remaining changes in Other loss, net for the year ended December 31, 2014 included lower
net losses from equity method investees.
Income Tax Provision. Income tax provision was $1.651 billion, $785 million and $1.614 billion for the years ended
December 31, 2015, 2014 and 2013, respectively. The Company’s effective tax rate was 30%, 17% and 32% for the years
ended December 31, 2015, 2014 and 2013, respectively. The increase in the effective tax rate in 2015 and the decrease in the
effective tax rate in 2014 was primarily due to the recognition of a tax benefit attributable to the reversal of tax reserves in
connection with a Federal tax settlement in 2014. In addition, the 2015 effective tax rate benefited from a higher percentage
of earnings from non-U.S. entities.
Income from Continuing Operations. Income from continuing operations was $3.795 billion, $3.894 billion and
$3.354 billion for the years ended December 31, 2015, 2014 and 2013, respectively. Excluding the items noted under
“Transactions and Other Items Affecting Comparability” totaling $148 million of expense, $234 million of income and
$47 million of income for the years ended December 31, 2015, 2014 and 2013, respectively, Income from continuing
operations increased $283 million and $353 million in 2015 and 2014, respectively. The increase in 2015 reflected higher
Operating Income, partially offset by higher income tax expense. The increase in 2014 primarily reflected lower income tax
expense, partially offset by lower Operating Income. Basic and diluted income per common share from continuing operations
attributable to Time Warner Inc. common shareholders were $4.64 and $4.58, respectively, for the year ended December 31,
2015, $4.49 and $4.41, respectively, for the year ended December 31, 2014 and $3.63 and $3.56, respectively, for the year
ended December 31, 2013.
Discontinued Operations, Net of Tax. Discontinued operations, net of tax was $37 million of income, $67 million of
loss and $337 million of income for the years ended December 31, 2015, 2014 and 2013, respectively. Basic and diluted
income per common share from discontinued operations attributable to Time Warner Inc. common shareholders were
$0.05 and $0.04, respectively, for the year ended December 31, 2015. Both basic and diluted loss per common share from
discontinued operations attributable to Time Warner Inc. common shareholders were $0.07 for the year ended December 31,
2014. Both basic and diluted income per common share from discontinued operations attributable to Time Warner Inc.
common shareholders were $0.36 for the year ended December 31, 2013.
35