Time Magazine 2015 Annual Report Download - page 135
Download and view the complete annual report
Please find page 135 of the 2015 Time Magazine annual report below. You can navigate through the pages in the report by either clicking on the pages listed below, or by using the keyword search tool below to find specific information within the annual report.-
 1
1 -
2
-
3
-
4
-
5
-
6
-
7
-
8
-
9
-
10
-
11
-
12
-
13
-
14
-
15
-
16
-
17
-
18
-
19
-
20
-
21
-
22
-
23
-
24
-
25
-
26
-
27
-
28
-
29
-
30
-
31
-
32
-
33
-
34
-
35
-
36
-
37
-
38
-
39
-
40
-
41
-
42
-
43
-
44
-
45
-
46
-
47
-
48
-
49
-
50
-
51
-
52
-
53
-
54
-
55
-
56
-
57
-
58
-
59
-
60
-
61
-
62
-
63
-
64
-
65
-
66
-
67
-
68
-
69
-
70
-
71
-
72
-
73
-
74
-
75
-
76
-
77
-
78
-
79
-
80
-
81
-
82
-
83
-
84
-
85
-
86
-
87
-
88
-
89
-
90
-
91
-
92
-
93
-
94
-
95
-
96
-
97
-
98
-
99
-
100
-
101
-
102
-
103
-
104
-
105
-
106
-
107
-
108
-
109
-
110
-
111
-
112
-
113
-
114
-
115
-
116
-
117
-
118
-
119
-
120
-
121
-
122
-
123
-
124
-
 125
125 -
 126
126 -
 127
127 -
 128
128 -
 129
129 -
 130
130 -
 131
131 -
 132
132 -
 133
133 -
 134
134 -
 135
135 -
 136
136 -
 137
137 -
 138
138 -
 139
139 -
 140
140
 |
 |
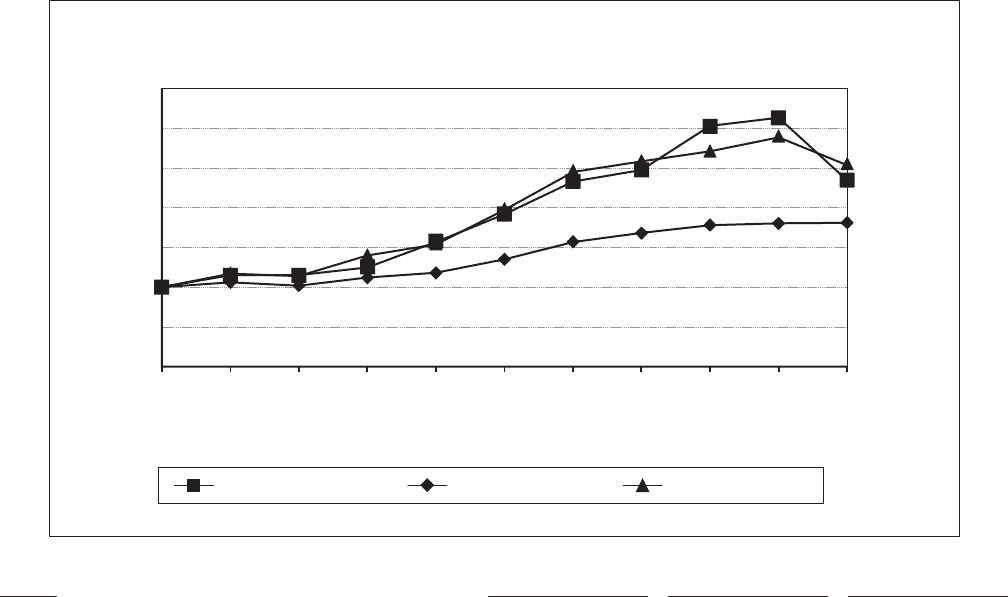
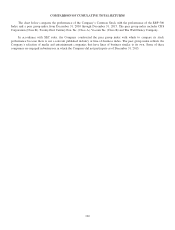
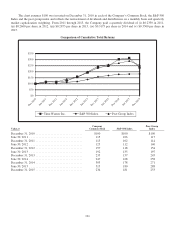
The chart assumes $100 was invested on December 31, 2010 in each of the Company’s Common Stock, the S&P 500
Index and the peer group index and reflects the reinvestment of dividends and distributions on a monthly basis and quarterly
market capitalization weighting. From 2011 through 2015, the Company paid a quarterly dividend of (i) $0.2350 in 2011,
(ii) $0.2600 per share in 2012, (iii) $0.2875 per share in 2013, (iv) $0.3175 per share in 2014 and (v) $0.3500 per share in
2015.
Comparison of Cumulative Total Returns
Dec 2010
$0
$100
$50
$200
$250
$150
$300
$350
Time Warner Inc. S&P 500 Index Peer Group Index
Jun 2011
Dec 2011
Jun 2012
Dec 2012
Jun 2013
Dec 2013
Jun 2014
Dec 2014
Jun 2015
Dec 2015
Value at
Company
Common Stock S&P 500 Index
Peer Group
Index
December 31, 2010 ............................... $100 $100 $100
June 30, 2011 ................................... 115 106 117
December 31, 2011 ............................... 115 102 114
June 30, 2012 ................................... 125 112 140
December 31, 2012 ............................... 157 118 154
June 30, 2013 ................................... 192 135 197
December 31, 2013 ............................... 233 157 245
June 30, 2014 ................................... 247 168 258
December 31, 2014 ............................... 303 178 271
June 30, 2015 ................................... 313 180 288
December 31, 2015 ............................... 234 181 253
121