Time Magazine 2015 Annual Report Download - page 122
Download and view the complete annual report
Please find page 122 of the 2015 Time Magazine annual report below. You can navigate through the pages in the report by either clicking on the pages listed below, or by using the keyword search tool below to find specific information within the annual report.-
 1
1 -
2
-
3
-
4
-
5
-
6
-
7
-
8
-
9
-
10
-
11
-
12
-
13
-
14
-
15
-
16
-
17
-
18
-
19
-
20
-
21
-
22
-
23
-
24
-
25
-
26
-
27
-
28
-
29
-
30
-
31
-
32
-
33
-
34
-
35
-
36
-
37
-
38
-
39
-
40
-
41
-
42
-
43
-
44
-
45
-
46
-
47
-
48
-
49
-
50
-
51
-
52
-
53
-
54
-
55
-
56
-
57
-
58
-
59
-
60
-
61
-
62
-
63
-
64
-
65
-
66
-
67
-
68
-
69
-
70
-
71
-
72
-
73
-
74
-
75
-
76
-
77
-
78
-
79
-
80
-
81
-
82
-
83
-
84
-
85
-
86
-
87
-
88
-
89
-
90
-
91
-
92
-
93
-
94
-
95
-
96
-
97
-
98
-
99
-
100
-
101
-
102
-
103
-
104
-
105
-
106
-
107
-
108
-
109
-
110
-
111
-
 112
112 -
 113
113 -
 114
114 -
 115
115 -
 116
116 -
 117
117 -
 118
118 -
 119
119 -
 120
120 -
 121
121 -
 122
122 -
 123
123 -
 124
124 -
 125
125 -
 126
126 -
 127
127 -
 128
128 -
 129
129 -
 130
130 -
 131
131 -
 132
132 -
133
-
134
-
135
-
136
-
137
-
138
-
139
-
140
 |
 |

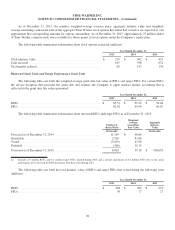
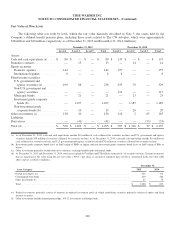
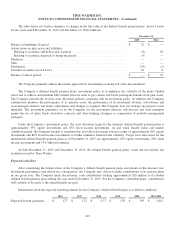
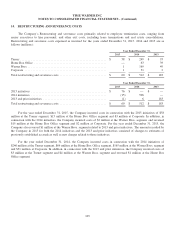
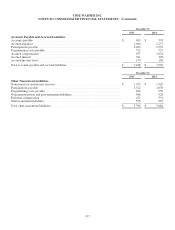
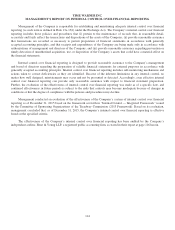
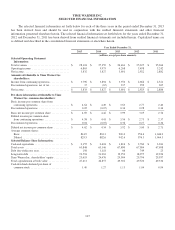
TIME WARNER INC.
NOTES TO CONSOLIDATED FINANCIAL STATEMENTS - (Continued)
Year Ended December 31,
2015 2014 2013
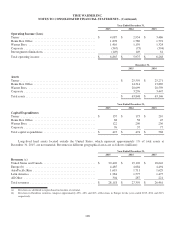
Operating Income (Loss)
Turner ................................................. $ 4,087 $ 2,954 $ 3,486
Home Box Office ........................................ 1,878 1,786 1,791
Warner Bros. ............................................ 1,416 1,159 1,324
Corporate ............................................... (367) (73) (394)
Intersegment eliminations .................................. (149) 149 61
Total operating income .................................... $ 6,865 $ 5,975 $ 6,268
December 31,
2015 2014
Assets
Turner ................................................................. $ 25,559 $ 25,271
Home Box Office ........................................................ 14,314 13,869
Warner Bros. ........................................................... 20,699 20,559
Corporate .............................................................. 3,276 3,447
Total assets ............................................................. $ 63,848 $ 63,146
Year Ended December 31,
2015 2014 2013
Capital Expenditures
Turner ................................................. $ 157 $ 173 $ 210
Home Box Office ........................................ 68 58 45
Warner Bros. ............................................ 122 206 236
Corporate ............................................... 76 37 77
Total capital expenditures .................................. $ 423 $ 474 $ 568
Long-lived hard assets located outside the United States, which represent approximately 1% of total assets at
December 31, 2015, are not material. Revenues in different geographical areas are as follows (millions):
Year Ended December 31,
2015 2014 2013
Revenues (a)
United States and Canada .................................. $ 20,426 $ 19,102 $ 18,642
Europe (b) .............................................. 4,485 4,684 4,494
Asia/Pacific Rim ......................................... 1,619 1,711 1,629
Latin America ........................................... 1,284 1,575 1,475
All Other ............................................... 304 287 221
Total revenues ........................................... $ 28,118 $ 27,359 $ 26,461
(a) Revenues are attributed to region based on location of customer.
(b) Revenues in EuroZone countries comprise approximately 49%, 48% and 48% of Revenues in Europe for the years ended 2015, 2014 and 2013,
respectively.
108