Time Magazine 2015 Annual Report Download - page 54
Download and view the complete annual report
Please find page 54 of the 2015 Time Magazine annual report below. You can navigate through the pages in the report by either clicking on the pages listed below, or by using the keyword search tool below to find specific information within the annual report.-
 1
1 -
2
-
3
-
4
-
5
-
6
-
7
-
8
-
9
-
10
-
11
-
12
-
13
-
14
-
15
-
16
-
17
-
18
-
19
-
20
-
21
-
22
-
23
-
24
-
25
-
26
-
27
-
28
-
29
-
30
-
31
-
32
-
33
-
34
-
35
-
36
-
37
-
38
-
39
-
40
-
41
-
42
-
43
-
 44
44 -
 45
45 -
 46
46 -
 47
47 -
 48
48 -
 49
49 -
 50
50 -
 51
51 -
 52
52 -
 53
53 -
 54
54 -
 55
55 -
 56
56 -
 57
57 -
 58
58 -
 59
59 -
 60
60 -
 61
61 -
 62
62 -
 63
63 -
 64
64 -
65
-
66
-
67
-
68
-
69
-
70
-
71
-
72
-
73
-
74
-
75
-
76
-
77
-
78
-
79
-
80
-
81
-
82
-
83
-
84
-
85
-
86
-
87
-
88
-
89
-
90
-
91
-
92
-
93
-
94
-
95
-
96
-
97
-
98
-
99
-
100
-
101
-
102
-
103
-
104
-
105
-
106
-
107
-
108
-
109
-
110
-
111
-
112
-
113
-
114
-
115
-
116
-
117
-
118
-
119
-
120
-
121
-
122
-
123
-
124
-
125
-
126
-
127
-
128
-
129
-
130
-
131
-
132
-
133
-
134
-
135
-
136
-
137
-
138
-
139
-
140
 |
 |

TIME WARNER INC.
MANAGEMENT’S DISCUSSION AND ANALYSIS
OF RESULTS OF OPERATIONS AND FINANCIAL CONDITION - (Continued)
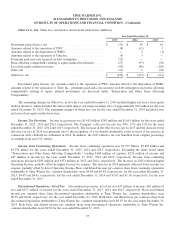
The results for the year ended December 31, 2014 included $63 million of Restructuring and severance costs primarily
related to headcount reductions in connection with restructuring activities designed to position the Company for the current
operating environment and reallocate resources to the Company’s growth initiatives. The results for the year ended
December 31, 2013 included $39 million of Restructuring and severance costs primarily related to executive severance costs.
The decrease in Operating Income for the year ended December 31, 2014 was primarily due to higher Costs of
revenues, the impact of the $113 million gain on operating assets on the 2013 results and higher Selling, general and
administrative expenses, partially offset by higher Revenues.
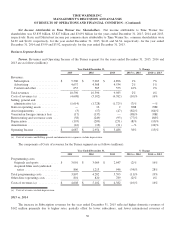
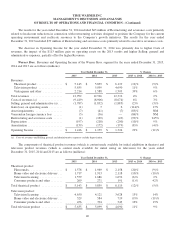
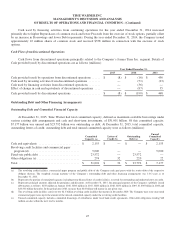
Warner Bros. Revenues and Operating Income of the Warner Bros. segment for the years ended December 31, 2015,
2014 and 2013 are as follows (millions):
Year Ended December 31, % Change
2015 2014 2013 2015 vs. 2014 2014 vs. 2013
Revenues:
Theatrical product ................. $ 5,143 $ 5,839 $ 6,119 (12)% (5)%
Television product ................ 5,635 5,099 4,690 11% 9%
Videogames and other ............. 2,214 1,588 1,503 39% 6%
Total revenues ..................... 12,992 12,526 12,312 4% 2%
Costs of revenues (a) ................ (9,419) (8,906) (8,674) 6% 3%
Selling, general and administrative (a) . . . (1,787) (1,832) (1,885) (2)% (3)%
Gain (loss) on operating assets ......... (1) 7 6 (114)% 17%
Asset impairments .................. (7) (41) (7) (83)% NM
Venezuelan foreign currency loss ...... (5) (36) — (86)% NM
Restructuring and severance costs ...... (1) (169) (49) (99)% 245%
Depreciation ....................... (197) (218) (200) (10)% 9%
Amortization ....................... (159) (172) (179) (8)% (4)%
Operating Income ................... $ 1,416 $ 1,159 $ 1,324 22% (12)%
(a) Costs of revenues and Selling, general and administrative expenses exclude depreciation.
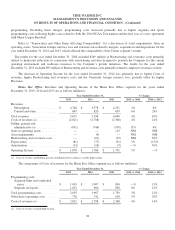
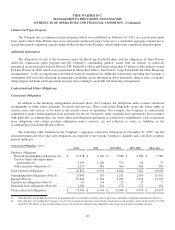
The components of theatrical product revenues (which is content made available for initial exhibition in theaters) and
television product revenues (which is content made available for initial airing on television) for the years ended
December 31, 2015, 2014 and 2013 are as follows (millions):
Year Ended December 31, % Change
2015 2014 2013 2015 vs. 2014 2014 vs. 2013
Theatrical product:
Film rentals ...................... $ 1,578 $ 1,969 $ 2,158 (20)% (9)%
Home video and electronic delivery . . . 1,717 1,913 2,118 (10)% (10)%
Television licensing ............... 1,579 1,686 1,652 (6)% 2%
Consumer products and other ........ 269 271 191 (1)% 42%
Total theatrical product .............. $ 5,143 $ 5,839 $ 6,119 (12)% (5)%
Television product:
Television licensing ............... 4,650 4,121 3,628 13% 14%
Home video and electronic delivery . . . 529 584 719 (9)% (19)%
Consumer products and other ........ 456 394 343 16% 15%
Total television product .............. $ 5,635 $ 5,099 $ 4,690 11% 9%
40