Time Magazine 2015 Annual Report Download - page 112
Download and view the complete annual report
Please find page 112 of the 2015 Time Magazine annual report below. You can navigate through the pages in the report by either clicking on the pages listed below, or by using the keyword search tool below to find specific information within the annual report.-
 1
1 -
2
-
3
-
4
-
5
-
6
-
7
-
8
-
9
-
10
-
11
-
12
-
13
-
14
-
15
-
16
-
17
-
18
-
19
-
20
-
21
-
22
-
23
-
24
-
25
-
26
-
27
-
28
-
29
-
30
-
31
-
32
-
33
-
34
-
35
-
36
-
37
-
38
-
39
-
40
-
41
-
42
-
43
-
44
-
45
-
46
-
47
-
48
-
49
-
50
-
51
-
52
-
53
-
54
-
55
-
56
-
57
-
58
-
59
-
60
-
61
-
62
-
63
-
64
-
65
-
66
-
67
-
68
-
69
-
70
-
71
-
72
-
73
-
74
-
75
-
76
-
77
-
78
-
79
-
80
-
81
-
82
-
83
-
84
-
85
-
86
-
87
-
88
-
89
-
90
-
91
-
92
-
93
-
94
-
95
-
96
-
97
-
98
-
99
-
100
-
101
-
 102
102 -
 103
103 -
 104
104 -
 105
105 -
 106
106 -
 107
107 -
 108
108 -
 109
109 -
 110
110 -
 111
111 -
 112
112 -
 113
113 -
 114
114 -
 115
115 -
 116
116 -
 117
117 -
 118
118 -
 119
119 -
 120
120 -
 121
121 -
 122
122 -
123
-
124
-
125
-
126
-
127
-
128
-
129
-
130
-
131
-
132
-
133
-
134
-
135
-
136
-
137
-
138
-
139
-
140
 |
 |

TIME WARNER INC.
NOTES TO CONSOLIDATED FINANCIAL STATEMENTS - (Continued)
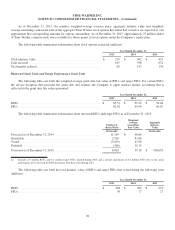
As of December 31, 2015, the number, weighted-average exercise price, aggregate intrinsic value and weighted-
average remaining contractual term of the aggregate Time Warner stock options that either had vested or are expected to vest
approximate the corresponding amounts for options outstanding. As of December 31, 2015, approximately 25 million shares
of Time Warner common stock were available for future grants of stock options under the Company’s equity plan.
The following table summarizes information about stock options exercised (millions):
Year Ended December 31,
2015 2014 2013
Total intrinsic value .......................................... $ 270 $ 402 $ 491
Cash received ............................................... 165 338 674
Tax benefits realized ......................................... 96 143 178
Restricted Stock Units and Target Performance Stock Units
The following table sets forth the weighted-average grant date fair value of RSUs and target PSUs. For certain PSUs,
the service inception date precedes the grant date and requires the Company to apply mark-to-market accounting that is
reflected in the grant date fair values presented:
Year Ended December 31,
2015 2014 2013
RSUs ..................................................... $ 83.52 $ 65.56 $ 54.04
PSUs ..................................................... 62.02 64.54 64.67
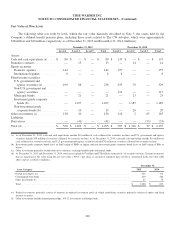
The following table summarizes information about unvested RSUs and target PSUs as of December 31, 2015:
Number of
Shares/Units
Weighted-
Average
Grant Date
Fair Value
Aggregate
Intrinsic
Value
(thousands) (thousands)
Unvested as of December 31, 2014 .............................. 11,109 $ 48.68
Granted(a) ................................................. 2,310 81.86
Vested .................................................... (5,039) 43.58
Forfeited .................................................. (360) 50.15
Unvested as of December 31, 2015 .............................. 8,020 59.58 $ 518,653
(a) Includes 2.0 million RSUs and 0.1 million target PSUs granted during 2015 and a payout adjustment of 0.2 million PSUs due to the actual
performance level achieved for PSUs granted in 2012 that vested during 2015.
The following table sets forth the total intrinsic value of RSUs and target PSUs that vested during the following years
(millions):
Year Ended December 31,
2015 2014 2013
RSUs ..................................................... $ 384 $ 366 $ 291
PSUs ..................................................... 30 17 27
98