Time Magazine 2015 Annual Report Download - page 46
Download and view the complete annual report
Please find page 46 of the 2015 Time Magazine annual report below. You can navigate through the pages in the report by either clicking on the pages listed below, or by using the keyword search tool below to find specific information within the annual report.-
 1
1 -
2
-
3
-
4
-
5
-
6
-
7
-
8
-
9
-
10
-
11
-
12
-
13
-
14
-
15
-
16
-
17
-
18
-
19
-
20
-
21
-
22
-
23
-
24
-
25
-
26
-
27
-
28
-
29
-
30
-
31
-
32
-
33
-
34
-
35
-
 36
36 -
 37
37 -
 38
38 -
 39
39 -
 40
40 -
 41
41 -
 42
42 -
 43
43 -
 44
44 -
 45
45 -
 46
46 -
 47
47 -
 48
48 -
 49
49 -
 50
50 -
 51
51 -
 52
52 -
 53
53 -
 54
54 -
 55
55 -
 56
56 -
57
-
58
-
59
-
60
-
61
-
62
-
63
-
64
-
65
-
66
-
67
-
68
-
69
-
70
-
71
-
72
-
73
-
74
-
75
-
76
-
77
-
78
-
79
-
80
-
81
-
82
-
83
-
84
-
85
-
86
-
87
-
88
-
89
-
90
-
91
-
92
-
93
-
94
-
95
-
96
-
97
-
98
-
99
-
100
-
101
-
102
-
103
-
104
-
105
-
106
-
107
-
108
-
109
-
110
-
111
-
112
-
113
-
114
-
115
-
116
-
117
-
118
-
119
-
120
-
121
-
122
-
123
-
124
-
125
-
126
-
127
-
128
-
129
-
130
-
131
-
132
-
133
-
134
-
135
-
136
-
137
-
138
-
139
-
140
 |
 |

TIME WARNER INC.
MANAGEMENT’S DISCUSSION AND ANALYSIS
OF RESULTS OF OPERATIONS AND FINANCIAL CONDITION - (Continued)
Group (“WMG”) in 2004. These amounts have been reflected in Other loss, net in the accompanying Consolidated Statement
of Operations.
Amounts Related to the Time Separation
For the year ended December 31, 2015, the Company recognized a loss of $9 million primarily reflecting pension and
other retirement benefits related to employees and former employees of Time Inc. For the year ended December 31, 2014,
the Company recognized income of $3 million related to the expiration, exercise and net change in the estimated fair value of
Time Warner equity awards held by certain Time Inc. employees. These amounts have been reflected in Other loss, net in the
accompanying Consolidated Statement of Operations.
Premiums Paid and Costs Incurred on Debt Redemption
For the year ended December 31, 2015, the Company recognized $72 million of premiums paid and costs incurred
principally to retire its 2016 Notes through a tender offer and redemption. This amount has been reflected in Other loss, net
in the accompanying Consolidated Statement of Operations.
Items Affecting Comparability Relating to Equity Method Investments
For the year ended December 31, 2015, the Company recognized $18 million related to asset impairments recorded by
an equity method investee, $8 million related to net losses from discontinued operations recorded by an equity method
investee and $1 million related to expenses recorded by an equity method investee related to government investigations. For
the year ended December 31, 2014, the Company recognized $70 million related to losses from discontinued operations
recorded by an equity method investee and $27 million related to a loss on the extinguishment of debt recorded by an equity
method investee. For the year ended December 31, 2013, the Company recognized $18 million related to noncash
impairments recorded by an equity method investee and $12 million related to a noncash loss on the extinguishment of debt
recorded by the equity method investee. These amounts have been reflected in Other loss, net in the accompanying
Consolidated Statement of Operations.
Income Tax Impact
The income tax impact reflects the estimated tax provision or tax benefit associated with each item affecting
comparability. The estimated tax provision or tax benefit can vary based on certain factors, including the taxability or
deductibility of the items and foreign tax on certain items. The income tax provision on the gain on the sale and leaseback of
the Company’s space in Time Warner Center in 2014 was offset by the utilization of tax attributes.
Consolidated Results
The following discussion provides an analysis of the Company’s results of operations and should be read in
conjunction with the accompanying Consolidated Statement of Operations.
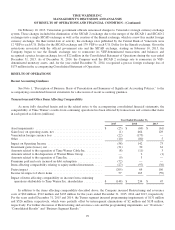
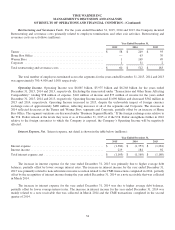
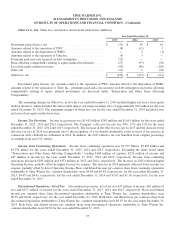
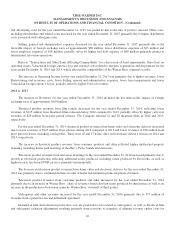
Revenues. The components of Revenues are as follows (millions):
Year Ended December 31, % Change
2015 2014 2013 2015 vs. 2014 2014 vs. 2013
Turner ....................... $ 10,596 $ 10,396 $ 9,983 2% 4%
Home Box Office .............. 5,615 5,398 4,890 4% 10%
Warner Bros. ................. 12,992 12,526 12,312 4% 2%
Intersegment eliminations ....... (1,085) (961) (724) 13% 33%
Total revenues ................ $ 28,118 $ 27,359 $ 26,461 3% 3%
32