Starwood 2007 Annual Report Download - page 98
Download and view the complete annual report
Please find page 98 of the 2007 Starwood annual report below. You can navigate through the pages in the report by either clicking on the pages listed below, or by using the keyword search tool below to find specific information within the annual report.-
 1
1 -
2
-
3
-
4
-
5
-
6
-
7
-
8
-
9
-
10
-
11
-
12
-
13
-
14
-
15
-
16
-
17
-
18
-
19
-
20
-
21
-
22
-
23
-
24
-
25
-
26
-
27
-
28
-
29
-
30
-
31
-
32
-
33
-
34
-
35
-
36
-
37
-
38
-
39
-
40
-
41
-
42
-
43
-
44
-
45
-
46
-
47
-
48
-
49
-
50
-
51
-
52
-
53
-
54
-
55
-
56
-
57
-
58
-
59
-
60
-
61
-
62
-
63
-
64
-
65
-
66
-
67
-
68
-
69
-
70
-
71
-
72
-
73
-
74
-
75
-
76
-
77
-
78
-
79
-
80
-
81
-
82
-
83
-
84
-
85
-
86
-
87
-
 88
88 -
 89
89 -
 90
90 -
 91
91 -
 92
92 -
 93
93 -
 94
94 -
 95
95 -
 96
96 -
 97
97 -
 98
98 -
 99
99 -
 100
100 -
 101
101 -
 102
102 -
 103
103 -
 104
104 -
 105
105 -
 106
106 -
 107
107 -
 108
108 -
109
-
110
-
111
-
112
-
113
-
114
-
115
-
116
-
117
-
118
-
119
-
120
-
121
-
122
-
123
-
124
-
125
-
126
-
127
-
128
-
129
-
130
-
131
-
132
-
133
-
134
-
135
-
136
-
137
-
138
-
139
-
140
-
141
-
142
-
143
-
144
-
145
-
146
-
147
-
148
-
149
-
150
-
151
-
152
-
153
-
154
-
155
-
156
-
157
-
158
-
159
-
160
-
161
-
162
-
163
-
164
-
165
-
166
-
167
-
168
-
169
-
170
-
171
-
172
-
173
-
174
 |
 |
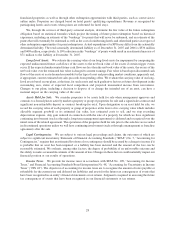
Equity Earnings and Gains and Losses from Unconsolidated Ventures, Net. Equity earnings and gains and
losses from unconsolidated joint ventures decreased to $61 million for the year ended December 31, 2006 from
$64 million in the same period of 2005.
Net Interest Expense. Net interest expense decreased to $215 million for the year ended December 31, 2006
as compared to $239 million in the same period of 2005, primarily due to interest savings from the reduction of our
debt with proceeds from the asset sales discussed earlier offset in part by increased interest rates. In addition, we
recorded interest income in 2006 of approximately $13 million in association with the full payment of principal and
interest on a loan receivable which was previously reserved. The decrease was partially offset by $37 million of
expenses related to the early extinguishment of debt in connection with two transactions completed in the first
quarter of 2006 whereby we defeased and were released from certain debt obligations that allowed us to sell certain
hotels that previously served as collateral for such debt. These transactions also resulted in the release of other
owned hotels as collateral, providing us with flexibility to sell or reposition those hotels. Our weighted average
interest rate was 6.97% at December 31, 2006 versus 6.27% at December 31, 2005.
Loss on Asset Dispositions and Impairments, Net. During 2006, we recorded a net loss of $3 million
primarily related to several offsetting gains and losses, including the sale of ten wholly-owned hotels, which were
sold unencumbered by management agreements, impairment charges related to various properties, including the
Sheraton Cancun which was damaged by Hurricane Wilma in 2005, and an adjustment to reduce the previously
recorded gain on the sale of a hotel consummated in 2004 as certain contingencies associated with the sale became
probable in 2006. These losses were primarily offset by a gain of $29 million on the sale of our interests in two joint
ventures and a $13 million gain as a result of insurance proceeds received as reimbursement for property damage
caused by Hurricane Wilma.
During 2005, we recorded a net loss of $30 million primarily related to the impairment of a hotel and
impairment charges associated with the Sheraton Cancun in Cancun, Mexico which was demolished in order to
build vacation ownership units. These losses were offset by net gains recorded on the sale of several hotels in 2005.
Income Tax Expense. We recorded an income tax benefit from continuing operations of $434 million for the
year ended December 31, 2006 compared to an expense of $219 million in the corresponding period of 2005. The
2006 tax benefit includes a one-time benefit of approximately $524 million realized in connection with the Host
Transaction, a $59 million benefit due primarily to the completion of various state and federal income tax audits of
prior years, a $34 million benefit associated with Company’s election to claim foreign tax credits in 2006 and 2005
and a $32 million benefit associated with the Trust prior to its acquisition by Host. The income tax expense for the
year ended December 31, 2005 included the recognition of $47 million of tax expense as a result of the adoption of a
plan to repatriate foreign earnings in accordance with the American Jobs Creation Act and the recording of an
additional provision of $52 million related to our 1998 disposition of ITT World Directories. The income tax
expense for the year ended December 31, 2005 also included a net tax credit of $15 million related to the deferred
gain on the sale of the Hotel Danieli in Venice, Italy, an $8 million benefit related to tax refunds for tax years prior to
the 1995 split-up of ITT Corporation, and a $64 million benefit associated with the Trust. Our effective income tax
rate is determined by the level and composition of pre-tax income subject to varying foreign, state and local taxes.
Discontinued Operations
For the year ended December 31, 2006, the loss on disposition represented a $2 million tax assessment
associated with the disposition of our gaming business in 1999. For the year ended December 31, 2005, the loss
from operations represented a $2 million sales and use tax assessment related to periods prior to our disposal of our
gaming business, offset by a $1 million income tax benefit related to this business.
LIQUIDITY AND CAPITAL RESOURCES
Cash From Operating Activities
Cash flow from operating activities is generated primarily from management and franchise revenues,
operating income from our owned hotels and sales of VOIs and residential units. It is the principal source of
34