Starwood 2007 Annual Report Download - page 93
Download and view the complete annual report
Please find page 93 of the 2007 Starwood annual report below. You can navigate through the pages in the report by either clicking on the pages listed below, or by using the keyword search tool below to find specific information within the annual report.-
 1
1 -
2
-
3
-
4
-
5
-
6
-
7
-
8
-
9
-
10
-
11
-
12
-
13
-
14
-
15
-
16
-
17
-
18
-
19
-
20
-
21
-
22
-
23
-
24
-
25
-
26
-
27
-
28
-
29
-
30
-
31
-
32
-
33
-
34
-
35
-
36
-
37
-
38
-
39
-
40
-
41
-
42
-
43
-
44
-
45
-
46
-
47
-
48
-
49
-
50
-
51
-
52
-
53
-
54
-
55
-
56
-
57
-
58
-
59
-
60
-
61
-
62
-
63
-
64
-
65
-
66
-
67
-
68
-
69
-
70
-
71
-
72
-
73
-
74
-
75
-
76
-
77
-
78
-
79
-
80
-
81
-
82
-
 83
83 -
 84
84 -
 85
85 -
 86
86 -
 87
87 -
 88
88 -
 89
89 -
 90
90 -
 91
91 -
 92
92 -
 93
93 -
 94
94 -
 95
95 -
 96
96 -
 97
97 -
 98
98 -
 99
99 -
 100
100 -
 101
101 -
 102
102 -
 103
103 -
104
-
105
-
106
-
107
-
108
-
109
-
110
-
111
-
112
-
113
-
114
-
115
-
116
-
117
-
118
-
119
-
120
-
121
-
122
-
123
-
124
-
125
-
126
-
127
-
128
-
129
-
130
-
131
-
132
-
133
-
134
-
135
-
136
-
137
-
138
-
139
-
140
-
141
-
142
-
143
-
144
-
145
-
146
-
147
-
148
-
149
-
150
-
151
-
152
-
153
-
154
-
155
-
156
-
157
-
158
-
159
-
160
-
161
-
162
-
163
-
164
-
165
-
166
-
167
-
168
-
169
-
170
-
171
-
172
-
173
-
174
 |
 |
RESULTS OF OPERATIONS
The following discussion presents an analysis of results of our operations for the years ended December 31,
2007, 2006 and 2005.
Year Ended December 31, 2007 Compared with Year Ended December 31, 2006
Continuing Operations
Revenues. Total revenues, including other revenues from managed and franchised properties, were
$6.153 billion, an increase of $174 million when compared to 2006 levels. Revenues reflected a 9.8% decrease
in revenues from our owned, leased and consolidated joint venture hotels to $2.429 billion for the year ended
December 31, 2007 when compared to $2.692 billion in the corresponding period of 2006, a 20.4% increase in
management fees, franchise fees and other income to $839 million for the year ended December 31, 2007 when
compared to $697 million in the corresponding period of 2006, a 2.0% increase in vacation ownership and
residential revenues to $1.025 billion for the year ended December 31, 2007 when compared to $1.005 billion in the
corresponding period of 2006, and an increase of $275 million in other revenues from managed and franchised
properties to $1.860 billion for the year ended December 31, 2007 when compared to $1.585 billion in the
corresponding period of 2006.
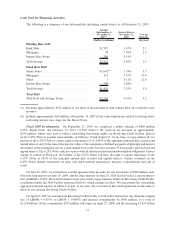
The $263 million decrease in revenues from owned, leased and consolidated joint venture hotels was primarily
due to lost revenues from 56 wholly owned hotels sold or closed in 2007 and 2006. The sold or closed hotels had
revenues of $121 million in the year ended December 31, 2007, compared to $570 million in the corresponding
period of 2006. The decrease in revenues from sold or closed hotels was partially offset by improved results at our
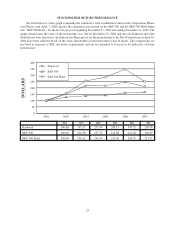
remaining owned, leased and consolidated joint venture hotels. Revenues at our Same-Store Owned Hotels (66
hotels for the year ended December 31, 2007 and 2006, excluding 56 hotels sold or closed and 8 hotels undergoing
significant repositionings or without comparable results in 2007 and 2006) increased 9.1%, or $173 million, to
$2.068 billion for the year ended December 31, 2007 when compared to $1.895 billion in the same period of 2006
due primarily to an increase in REVPAR. REVPAR at our Same-Store Owned Hotels increased 10.2% to $160.38
for the year ended December 31, 2007 when compared to the corresponding 2006 period. The increase in REVPAR
at these Same-Store Owned Hotels was attributed to a 9.2% increase in ADR to $222.03 for the year ended
December 31, 2007 compared to $203.31 for the corresponding 2006 period and due to a slight increase in
occupancy rates to 72.2% in the year ended December 31, 2007 when compared to 71.6% in the same period in
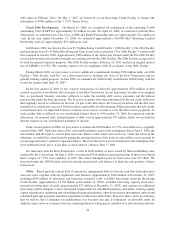
2006. REVPAR at Same-Store Owned Hotels in North America increased 7.3% for the year ended December 31,
2007 when compared to the same period of 2006. REVPAR growth was particularly strong at our owned hotels in
Kauai, Hawaii, New York, New York, San Francisco, California and New Orleans, Louisiana. REVPAR at our
international Same-Store Owned Hotels increased by 15.6% for the year ended December 31, 2007 when compared
to the same period of 2006. REVPAR growth was particularly strong at our owned hotels in Australia, Austria and
Italy. REVPAR for Same-Store Owned Hotels internationally increased 7.8% excluding the favorable effects of
foreign currency translation.
The increase in management fees, franchise fees and other income of $142 million was primarily a result of a
$123 million increase in management and franchise revenue to $687 million for the year ended December 31, 2007.
The increase was due to the strong growth in REVPAR at existing hotels under management and the net addition of
34 managed and franchised hotels to our system. The increase in management and franchise fees also resulted from
the full year impact of revenues from the 33 hotels sold to Host in the second quarter of 2006. Management fees
from these hotels in the year ended December 31, 2007 totaled $63 million, as compared to $44 million in the same
period of 2006. Revenues from the amortization of the deferred gain associated with the Host Transaction was
$49 million in the year ended December 31, 2007, as compared to $34 million in the corresponding period of 2006.
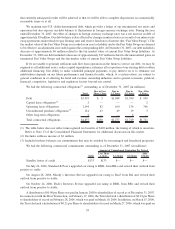
Other income increased $19 million and includes $18 million of income earned in the first quarter of 2007 from our
carried interest in a managed hotel that was sold in January 2007. These increases were partially offset by lost fees
from contracts that were terminated in the last 12 months.
The increase in vacation ownership and residential sales and services of $20 million was primarily due to the
revenue recognition from ongoing projects under construction in Hawaii which are being accounted for under
percentage of completion accounting. This net increase was offset, in part, by a decrease in residential sales as the
29