Starwood 2007 Annual Report Download - page 84
Download and view the complete annual report
Please find page 84 of the 2007 Starwood annual report below. You can navigate through the pages in the report by either clicking on the pages listed below, or by using the keyword search tool below to find specific information within the annual report.-
 1
1 -
2
-
3
-
4
-
5
-
6
-
7
-
8
-
9
-
10
-
11
-
12
-
13
-
14
-
15
-
16
-
17
-
18
-
19
-
20
-
21
-
22
-
23
-
24
-
25
-
26
-
27
-
28
-
29
-
30
-
31
-
32
-
33
-
34
-
35
-
36
-
37
-
38
-
39
-
40
-
41
-
42
-
43
-
44
-
45
-
46
-
47
-
48
-
49
-
50
-
51
-
52
-
53
-
54
-
55
-
56
-
57
-
58
-
59
-
60
-
61
-
62
-
63
-
64
-
65
-
66
-
67
-
68
-
69
-
70
-
71
-
72
-
73
-
 74
74 -
 75
75 -
 76
76 -
 77
77 -
 78
78 -
 79
79 -
 80
80 -
 81
81 -
 82
82 -
 83
83 -
 84
84 -
 85
85 -
 86
86 -
 87
87 -
 88
88 -
 89
89 -
 90
90 -
 91
91 -
 92
92 -
 93
93 -
 94
94 -
95
-
96
-
97
-
98
-
99
-
100
-
101
-
102
-
103
-
104
-
105
-
106
-
107
-
108
-
109
-
110
-
111
-
112
-
113
-
114
-
115
-
116
-
117
-
118
-
119
-
120
-
121
-
122
-
123
-
124
-
125
-
126
-
127
-
128
-
129
-
130
-
131
-
132
-
133
-
134
-
135
-
136
-
137
-
138
-
139
-
140
-
141
-
142
-
143
-
144
-
145
-
146
-
147
-
148
-
149
-
150
-
151
-
152
-
153
-
154
-
155
-
156
-
157
-
158
-
159
-
160
-
161
-
162
-
163
-
164
-
165
-
166
-
167
-
168
-
169
-
170
-
171
-
172
-
173
-
174
 |
 |

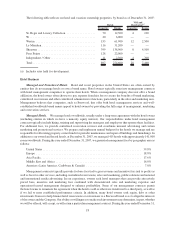
The following represents our top five international markets by country as a percentage of our total owned,
leased and consolidated joint venture revenues for the year ended December 31, 2007 (with comparable data for
2006):
Top Five International Markets as a % of Total Owned Revenues
for the Year Ended December 31, 2007 with Comparable Data for 2006
(1)
Country
2007
Revenues
2006
Revenues
Italy ........................................................ 8.6% 7.9%
Canada ...................................................... 8.0% 6.3%
Mexico ...................................................... 5.1% 4.5%
Australia..................................................... 4.3% 3.0%
United Kingdom ............................................... 3.3% 3.0%
(1) Includes the revenues of hotels sold for the period prior to their sale.
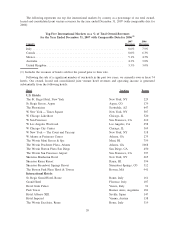
Following the sale of a significant number of our hotels in the past two years, we currently own or lease 74
hotels. Our owned, leased and consolidated joint venture hotel revenues and operating income is generated
substantially from the following hotels:
Hotel Location Rooms
U.S. Hotels:
The St. Regis Hotel, New York New York, NY 229
St. Regis Resort, Aspen Aspen, CO 179
The Phoenician Scottsdale, AZ 647
W New York — Times Square New York, NY 507
W Chicago Lakeshore Chicago, IL 520
W San Francisco San Francisco, CA 410
W Los Angeles Westwood Los Angeles, CA 258
W Chicago City Center Chicago, IL 369
W New York — The Court and Tuscany New York, NY 318
W Atlanta at Perimeter Center Atlanta, GA 275
The Westin Maui Resort & Spa Maui, HI 759
The Westin Peachtree Plaza, Atlanta Atlanta, GA 1068
The Westin Horton Plaza San Diego San Diego, CA 450
The Westin San Francisco Airport San Francisco, CA 397
Sheraton Manhattan Hotel New York, NY 665
Sheraton Kauai Resort Kauai, HI 394
Sheraton Steamboat Springs Resort Steamboat Springs, CO 312
The Boston Park Plaza Hotel & Towers Boston, MA 941
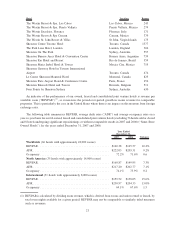
International Hotels:
St. Regis Grand Hotel, Rome Rome, Italy 161
Grand Hotel Florence, Italy 107
Hotel Gritti Palace Venice, Italy 91
Park Tower Buenos Aires, Argentina 181
Hotel Alfonso XIII Seville, Spain 147
Hotel Imperial Vienna, Austria 138
The Westin Excelsior, Rome Rome, Italy 319
20