Starwood 2007 Annual Report Download - page 155
Download and view the complete annual report
Please find page 155 of the 2007 Starwood annual report below. You can navigate through the pages in the report by either clicking on the pages listed below, or by using the keyword search tool below to find specific information within the annual report.-
 1
1 -
2
-
3
-
4
-
5
-
6
-
7
-
8
-
9
-
10
-
11
-
12
-
13
-
14
-
15
-
16
-
17
-
18
-
19
-
20
-
21
-
22
-
23
-
24
-
25
-
26
-
27
-
28
-
29
-
30
-
31
-
32
-
33
-
34
-
35
-
36
-
37
-
38
-
39
-
40
-
41
-
42
-
43
-
44
-
45
-
46
-
47
-
48
-
49
-
50
-
51
-
52
-
53
-
54
-
55
-
56
-
57
-
58
-
59
-
60
-
61
-
62
-
63
-
64
-
65
-
66
-
67
-
68
-
69
-
70
-
71
-
72
-
73
-
74
-
75
-
76
-
77
-
78
-
79
-
80
-
81
-
82
-
83
-
84
-
85
-
86
-
87
-
88
-
89
-
90
-
91
-
92
-
93
-
94
-
95
-
96
-
97
-
98
-
99
-
100
-
101
-
102
-
103
-
104
-
105
-
106
-
107
-
108
-
109
-
110
-
111
-
112
-
113
-
114
-
115
-
116
-
117
-
118
-
119
-
120
-
121
-
122
-
123
-
124
-
125
-
126
-
127
-
128
-
129
-
130
-
131
-
132
-
133
-
134
-
135
-
136
-
137
-
138
-
139
-
140
-
141
-
142
-
143
-
144
-
 145
145 -
 146
146 -
 147
147 -
 148
148 -
 149
149 -
 150
150 -
 151
151 -
 152
152 -
 153
153 -
 154
154 -
 155
155 -
 156
156 -
 157
157 -
 158
158 -
 159
159 -
 160
160 -
 161
161 -
 162
162 -
 163
163 -
 164
164 -
 165
165 -
166
-
167
-
168
-
169
-
170
-
171
-
172
-
173
-
174
 |
 |

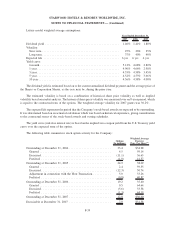
The following table presents the components of net periodic benefit cost for the years ended December 31,
2007, 2006 and 2005 (in millions):
2007 2006 2005 2007 2006 2005 2007 2006 2005
Pension Benefits Foreign Pension Benefits Postretirement Benefits
Service cost ......................... $— $— $— $ 5 $ 4 $ 4 $— $— $—
Interest cost ......................... 1 1 1 12 10 8 1 1 1
Expected return on plan assets ........... — — — (11) (9) (8) (1) (1) (1)
Amortization of actuarial loss ............ — — — 2 3 3 — — —
SFAS No. 87 cost/SFAS No. 106 cost ...... 1 1 1 8 8 7 — — —
SFAS No. 88 settlement and curtailment
gain ............................. — — — — (3) ————
Net periodic benefit cost ................ $ 1 $ 1 $ 1 $ 8 $ 5 $ 7 $— $— $—
For measurement purposes, a 9% annual rate of increase in the per capita cost of covered health care benefits
was assumed for 2008, gradually decreasing to 5% in 2013. A one-percentage-point change in assumed health care
cost trend rates would have approximately a $0.4 million effect on the postretirement obligation and a nominal
impact on the total of service and interest cost components of net periodic benefit cost.
The weighted average assumptions used to determine benefit obligations at December 31 were as follows:
2007 2006 2007 2006 2007 2006
Pension Benefits
Foreign Pension
Benefits
Postretirement
Benefits
Discount rate ...................................... 5.75% 5.75% 5.88% 5.46% 5.74% 5.74%
Rate of compensation increase. . . ....................... N/A N/A 3.90% 3.90% N/A N/A
The weighted average assumptions used to determine net periodic benefit cost for the years ended December
31 were as follows:
2007 2006 2005 2007 2006 2005 2007 2006 2005
Pension Benefits Foreign Pension Benefits Postretirement Benefits
Discount rate ..................... 5.75% 5.50% 5.51% 5.46% 5.09% 5.49% 5.74% 5.49% 5.50%
Rate of compensation increase ........ N/A N/A N/A 3.90% 3.60% 3.62% N/A N/A N/A
Expected return on plan assets ........ N/A N/A N/A 6.40% 6.91% 7.10% 7.50% 7.50% 8.00%
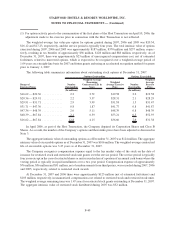
A number of factors were considered in the determination of the expected return on plan assets. These factors
included current and expected allocation of plan assets, the investment strategy, historical rates of return and
Company and investment expert expectations for investment performance over approximately a ten year period.
The weighted average asset allocations at December 31, 2007 and 2006 for the Company’s defined benefit
pension and postretirement benefit plans and the Company’s current target asset allocation ranges are as follows:
Target
Allocation 2007 2006
Target
Allocation 2007 2006
Target
Allocation 2007 2006
Percentage of
Plan Assets
Percentage of
Plan Assets
Percentage of
Plan Assets
Pension Benefits Foreign Pension Benefits Postretirement Benefits
Equity securities ............. N/A N/A N/A 36% 45% 59% 63% 63% 75%
Debt securities .............. N/A N/A N/A 62% 48% 39% 35% 35% 25%
Cash and other .............. N/A N/A N/A 2% 7% 2% 2% 2% 0%
100% 100% 100% 100% 100% 100%
F-35
STARWOOD HOTELS & RESORTS WORLDWIDE, INC.
NOTES TO FINANCIAL STATEMENTS — (Continued)