Starwood 2007 Annual Report Download - page 159
Download and view the complete annual report
Please find page 159 of the 2007 Starwood annual report below. You can navigate through the pages in the report by either clicking on the pages listed below, or by using the keyword search tool below to find specific information within the annual report.-
 1
1 -
2
-
3
-
4
-
5
-
6
-
7
-
8
-
9
-
10
-
11
-
12
-
13
-
14
-
15
-
16
-
17
-
18
-
19
-
20
-
21
-
22
-
23
-
24
-
25
-
26
-
27
-
28
-
29
-
30
-
31
-
32
-
33
-
34
-
35
-
36
-
37
-
38
-
39
-
40
-
41
-
42
-
43
-
44
-
45
-
46
-
47
-
48
-
49
-
50
-
51
-
52
-
53
-
54
-
55
-
56
-
57
-
58
-
59
-
60
-
61
-
62
-
63
-
64
-
65
-
66
-
67
-
68
-
69
-
70
-
71
-
72
-
73
-
74
-
75
-
76
-
77
-
78
-
79
-
80
-
81
-
82
-
83
-
84
-
85
-
86
-
87
-
88
-
89
-
90
-
91
-
92
-
93
-
94
-
95
-
96
-
97
-
98
-
99
-
100
-
101
-
102
-
103
-
104
-
105
-
106
-
107
-
108
-
109
-
110
-
111
-
112
-
113
-
114
-
115
-
116
-
117
-
118
-
119
-
120
-
121
-
122
-
123
-
124
-
125
-
126
-
127
-
128
-
129
-
130
-
131
-
132
-
133
-
134
-
135
-
136
-
137
-
138
-
139
-
140
-
141
-
142
-
143
-
144
-
145
-
146
-
147
-
148
-
 149
149 -
 150
150 -
 151
151 -
 152
152 -
 153
153 -
 154
154 -
 155
155 -
 156
156 -
 157
157 -
 158
158 -
 159
159 -
 160
160 -
 161
161 -
 162
162 -
 163
163 -
 164
164 -
 165
165 -
 166
166 -
 167
167 -
 168
168 -
 169
169 -
170
-
171
-
172
-
173
-
174
 |
 |

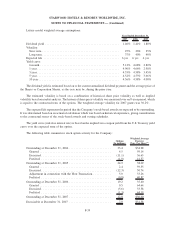
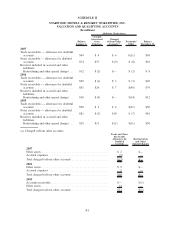
Lattice model weighted average assumptions:
2007 2006 2005
Year Ended December 31,
Dividend yield .............................................. 1.40% 1.41% 1.80%
Volatility:
Near term ................................................ 25% 26% 25%
Long term................................................ 37% 40% 40%
Expected life ............................................... 6yrs 6yrs 6yrs
Yield curve:
6 month ................................................. 5.12% 4.68% 2.80%
1 year . . ................................................. 4.96% 4.66% 2.98%
3 year . . ................................................. 4.55% 4.58% 3.45%
5 year . . ................................................. 4.52% 4.53% 3.66%
10 year . ................................................. 4.56% 4.58% 4.08%
The dividend yield is estimated based on to the current annualized dividend payment and the average price of
the Shares or Corporation Shares, as the case may be, during the prior year.
The estimated volatility is based on a combination of historical share price volatility as well as implied
volatility based on market analysis. The historical share price volatility was measured over an 8-year period, which
is equal to the contractual term of the options. The weighted average volatility for 2007 grants was 30.2%.
The expected life represents the period that the Company’s stock-based awards are expected to be outstanding.
It was determined based on an actuarial calculation which was based on historical experience, giving consideration
to the contractual terms of the stock-based awards and vesting schedules.
The yield curve (risk-free interest rate) is based on the implied zero-coupon yield from the U.S. Treasury yield
curve over the expected term of the option.
The following table summarizes stock option activity for the Company:
Options
(In millions)
Weighted Average
Exercise
Price Per Share
(1)
Outstanding at December 31, 2004 .......................... 33.4 $34.98
Granted ............................................ 4.5 59.14
Exercised ........................................... (11.1) 36.63
Forfeited ........................................... (1.9) 41.57
Outstanding at December 31, 2005 .......................... 24.9 38.09
Granted ............................................ 2.4 59.55
Exercised ........................................... (12.3) 30.74
Adjustment in connection with the Host Transaction ........... 5.0 33.26
Forfeited ........................................... (0.8) 40.87
Outstanding at December 31, 2006 .......................... 19.2 35.40
Granted ............................................ 0.5 64.64
Exercised ........................................... (5.6) 33.38
Forfeited ........................................... (1.3) 44.19
Outstanding at December 31, 2007 .......................... 12.8 $36.60
Exercisable at December 31, 2007 .......................... 7.9 $31.38
F-39
STARWOOD HOTELS & RESORTS WORLDWIDE, INC.
NOTES TO FINANCIAL STATEMENTS — (Continued)