Starwood 2007 Annual Report Download - page 136
Download and view the complete annual report
Please find page 136 of the 2007 Starwood annual report below. You can navigate through the pages in the report by either clicking on the pages listed below, or by using the keyword search tool below to find specific information within the annual report.-
 1
1 -
2
-
3
-
4
-
5
-
6
-
7
-
8
-
9
-
10
-
11
-
12
-
13
-
14
-
15
-
16
-
17
-
18
-
19
-
20
-
21
-
22
-
23
-
24
-
25
-
26
-
27
-
28
-
29
-
30
-
31
-
32
-
33
-
34
-
35
-
36
-
37
-
38
-
39
-
40
-
41
-
42
-
43
-
44
-
45
-
46
-
47
-
48
-
49
-
50
-
51
-
52
-
53
-
54
-
55
-
56
-
57
-
58
-
59
-
60
-
61
-
62
-
63
-
64
-
65
-
66
-
67
-
68
-
69
-
70
-
71
-
72
-
73
-
74
-
75
-
76
-
77
-
78
-
79
-
80
-
81
-
82
-
83
-
84
-
85
-
86
-
87
-
88
-
89
-
90
-
91
-
92
-
93
-
94
-
95
-
96
-
97
-
98
-
99
-
100
-
101
-
102
-
103
-
104
-
105
-
106
-
107
-
108
-
109
-
110
-
111
-
112
-
113
-
114
-
115
-
116
-
117
-
118
-
119
-
120
-
121
-
122
-
123
-
124
-
125
-
 126
126 -
 127
127 -
 128
128 -
 129
129 -
 130
130 -
 131
131 -
 132
132 -
 133
133 -
 134
134 -
 135
135 -
 136
136 -
 137
137 -
 138
138 -
 139
139 -
 140
140 -
 141
141 -
 142
142 -
 143
143 -
 144
144 -
 145
145 -
 146
146 -
147
-
148
-
149
-
150
-
151
-
152
-
153
-
154
-
155
-
156
-
157
-
158
-
159
-
160
-
161
-
162
-
163
-
164
-
165
-
166
-
167
-
168
-
169
-
170
-
171
-
172
-
173
-
174
 |
 |

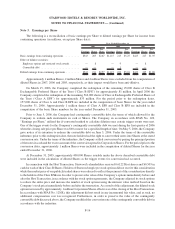
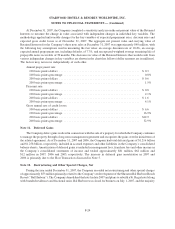
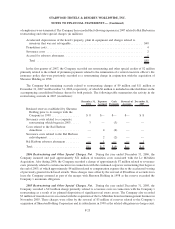
Note 3. Earnings per Share
The following is a reconciliation of basic earnings per Share to diluted earnings per Share for income from
continuing operations (in millions, except per Share data):
Earnings Shares
Per
Share Earnings Shares
Per
Share Earnings Shares
Per
Share
2007 2006 2005
Year Ended December 31,
Basic earnings from continuing operations .......... $543 203 $2.67 $1,115 213 $5.25 $423 217 $1.95
Effect of dilutive securities:
Employee options and restricted stock awards ...... — 8 — 9 — 8
Convertible debt . . . ....................... — — — 1 — —
Diluted earnings from continuing operations ......... $543 211 $2.57 $1,115 223 $5.01 $423 225 $1.88
Approximately 1 million Shares, 2 million Shares and 4 million Shares were excluded from the computation of
diluted Shares in 2007, 2006 and 2005, respectively, as their impact would have been anti-dilutive.
On March 15, 2006, the Company completed the redemption of the remaining 25,000 shares of Class B
Exchangeable Preferred Shares of the Trust (“Class B EPS”) for approximately $1 million. In April 2006 the
Company completed the redemption of the remaining 562,000 shares of Class A Exchangeable Preferred Shares of
the Trust (“Class A EPS”) for approximately $33 million. For the period prior to the redemption dates,
157,000 shares of Class A and Class B EPS are included in the computation of basic Shares for the year ended
December 31, 2006. Approximately 1 million shares of Class A EPS and Class B EPS are included in the
computation of the basic Share numbers for the year ended December 31, 2005.
Prior to June 5, 2006, the Company had contingently convertible debt, the terms of which allowed for the
Company to redeem such instruments in cash or Shares. The Company, in accordance with SFAS No. 128,
“Earnings per Share,” utilized the if-converted method to calculate dilution once certain trigger events were met.
One of the trigger events for the Company’s contingently convertible debt was met during the first quarter of 2006
when the closing sale price per Share was $60 or more for a specified length of time. On May 5, 2006, the Company
gave notice of its intention to redeem the convertible debt on June 5, 2006. Under the terms of the convertible
indenture, prior to this redemption date, the note holders had the right to convert their notes into Shares at the stated
conversion rate. Under the terms of the indenture, the Company settled conversions by paying the principal portion
of the notes in cash and the excess amount of the conversion spread in Corporation Shares. For the period prior to the
conversion dates, approximately 1 million Shares were included in the computation of diluted Shares for the year
ended December 31, 2006.
At December 31, 2005, approximately 400,000 Shares issuable under the above described convertible debt
were included in the calculation of diluted Shares as the trigger events for conversion had occurred.
In connection with the Host Transaction, Starwood’s shareholders received 0.6122 Host shares and $0.503 in
cash for each of their Class B Shares. Holders of Starwood employee stock options did not receive this consideration
while the market price of our publicly traded shares was reduced to reflect the payment of this consideration directly
to the holders of the Class B Shares. In order to preserve the value of the Company’s options immediately before and
after the Host Transaction, in accordance with the stock option agreements, the Company adjusted its stock options
to reduce the strike price and increase the number of stock options using the intrinsic value method based on the
Company’s stock price immediately before and after the transaction. As a result of this adjustment, the diluted stock
options increased by approximately 1 million Corporation Shares effective as of the closing of the Host Transaction.
In accordance with SFAS No. 123(R), this adjustment did not result in any incremental fair value, and as such, no
additional compensation cost was recognized. Furthermore, in order to preserve the value of the contingently
convertible debt discussed above, the Company modified the conversion rate of the contingently convertible debt in
accordance with the indenture.
F-16
STARWOOD HOTELS & RESORTS WORLDWIDE, INC.
NOTES TO FINANCIAL STATEMENTS — (Continued)