Starwood 2007 Annual Report Download - page 85
Download and view the complete annual report
Please find page 85 of the 2007 Starwood annual report below. You can navigate through the pages in the report by either clicking on the pages listed below, or by using the keyword search tool below to find specific information within the annual report.-
 1
1 -
2
-
3
-
4
-
5
-
6
-
7
-
8
-
9
-
10
-
11
-
12
-
13
-
14
-
15
-
16
-
17
-
18
-
19
-
20
-
21
-
22
-
23
-
24
-
25
-
26
-
27
-
28
-
29
-
30
-
31
-
32
-
33
-
34
-
35
-
36
-
37
-
38
-
39
-
40
-
41
-
42
-
43
-
44
-
45
-
46
-
47
-
48
-
49
-
50
-
51
-
52
-
53
-
54
-
55
-
56
-
57
-
58
-
59
-
60
-
61
-
62
-
63
-
64
-
65
-
66
-
67
-
68
-
69
-
70
-
71
-
72
-
73
-
74
-
 75
75 -
 76
76 -
 77
77 -
 78
78 -
 79
79 -
 80
80 -
 81
81 -
 82
82 -
 83
83 -
 84
84 -
 85
85 -
 86
86 -
 87
87 -
 88
88 -
 89
89 -
 90
90 -
 91
91 -
 92
92 -
 93
93 -
 94
94 -
 95
95 -
96
-
97
-
98
-
99
-
100
-
101
-
102
-
103
-
104
-
105
-
106
-
107
-
108
-
109
-
110
-
111
-
112
-
113
-
114
-
115
-
116
-
117
-
118
-
119
-
120
-
121
-
122
-
123
-
124
-
125
-
126
-
127
-
128
-
129
-
130
-
131
-
132
-
133
-
134
-
135
-
136
-
137
-
138
-
139
-
140
-
141
-
142
-
143
-
144
-
145
-
146
-
147
-
148
-
149
-
150
-
151
-
152
-
153
-
154
-
155
-
156
-
157
-
158
-
159
-
160
-
161
-
162
-
163
-
164
-
165
-
166
-
167
-
168
-
169
-
170
-
171
-
172
-
173
-
174
 |
 |

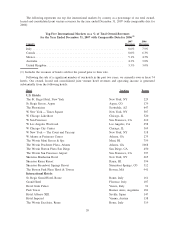
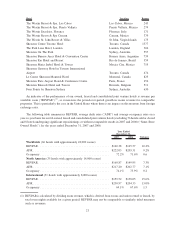
Hotel Location Rooms
The Westin Resort & Spa, Los Cabos Los Cabos, Mexico 243
The Westin Resort & Spa, Puerto Vallarta Puerto Vallarta, Mexico 279
The Westin Excelsior, Florence Florence, Italy 171
The Westin Resort & Spa Cancun Cancun, Mexico 379
The Westin St. John Resort & Villas St John, Virgin Islands 175
Sheraton Centre Toronto Hotel Toronto, Canada 1377
The Park Lane Hotel, London London, England 302
Sheraton On The Park Sydney, Australia 557
Sheraton Buenos Aires Hotel & Convention Center Buenos Aires, Argentina 739
Sheraton Rio Hotel and Resort Rio de Janeiro, Brazil 559
Sheraton Maria Isabel Hotel & Towers Mexico City, Mexico 755
Sheraton Gateway Hotel in Toronto International
Airport Toronto, Canada 474
Le Centre Sheraton Montreal Hotel Montreal, Canada 825
Sheraton Paris Airport Hotel & Conference Centre Paris, France 252
Sheraton Brussels Hotel and Towers Brussels, Belgium 511
Four Points by Sheraton Sydney Sydney, Australia 630
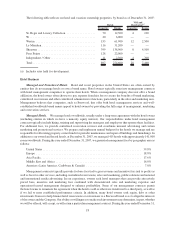
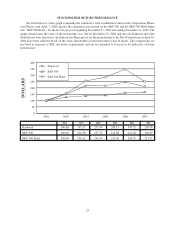
An indicator of the performance of our owned, leased and consolidated joint venture hotels is revenue per
available room (“REVPAR”)
(1)
, as it measures the period-over-period growth in rooms revenue for comparable
properties. This is particularly the case in the United States where there is no impact on this measure from foreign
exchange rates.
The following table summarizes REVPAR, average daily rates (“ADR”) and average occupancy rates on a
year-to-year basis for our 66 owned, leased and consolidated joint venture hotels (excluding 56 hotels sold or closed
and 8 hotels undergoing significant repositionings or without comparable results in 2007 and 2006) (“Same-Store
Owned Hotels”) for the years ended December 31, 2007 and 2006:
2007 2006 Variance
Year Ended
December 31,
Worldwide (66 hotels with approximately 22,000 rooms)
REVPAR ............................................ $160.38 $145.57 10.2%
ADR............................................... $222.03 $203.31 9.2%
Occupancy ........................................... 72.2% 71.6% 0.6
North America (35 hotels with approximately 14,000 rooms)
REVPAR ............................................ $160.87 $149.95 7.3%
ADR............................................... $217.20 $202.77 7.1%
Occupancy ........................................... 74.1% 73.9% 0.2
International (31 hotels with approximately 8,000 rooms)
REVPAR ............................................ $159.52 $138.05 15.6%
ADR............................................... $230.97 $204.33 13.0%
Occupancy ........................................... 69.1% 67.6% 1.5
(1) REVPAR is calculated by dividing room revenue, which is derived from rooms and suites rented or leased, by
total room nights available for a given period. REVPAR may not be comparable to similarly titled measures
such as revenues.
21