Starwood 2007 Annual Report Download - page 68
Download and view the complete annual report
Please find page 68 of the 2007 Starwood annual report below. You can navigate through the pages in the report by either clicking on the pages listed below, or by using the keyword search tool below to find specific information within the annual report.-
 1
1 -
2
-
3
-
4
-
5
-
6
-
7
-
8
-
9
-
10
-
11
-
12
-
13
-
14
-
15
-
16
-
17
-
18
-
19
-
20
-
21
-
22
-
23
-
24
-
25
-
26
-
27
-
28
-
29
-
30
-
31
-
32
-
33
-
34
-
35
-
36
-
37
-
38
-
39
-
40
-
41
-
42
-
43
-
44
-
45
-
46
-
47
-
48
-
49
-
50
-
51
-
52
-
53
-
54
-
55
-
56
-
57
-
 58
58 -
 59
59 -
 60
60 -
 61
61 -
 62
62 -
 63
63 -
 64
64 -
 65
65 -
 66
66 -
 67
67 -
 68
68 -
 69
69 -
 70
70 -
 71
71 -
 72
72 -
 73
73 -
 74
74 -
 75
75 -
 76
76 -
 77
77 -
 78
78 -
79
-
80
-
81
-
82
-
83
-
84
-
85
-
86
-
87
-
88
-
89
-
90
-
91
-
92
-
93
-
94
-
95
-
96
-
97
-
98
-
99
-
100
-
101
-
102
-
103
-
104
-
105
-
106
-
107
-
108
-
109
-
110
-
111
-
112
-
113
-
114
-
115
-
116
-
117
-
118
-
119
-
120
-
121
-
122
-
123
-
124
-
125
-
126
-
127
-
128
-
129
-
130
-
131
-
132
-
133
-
134
-
135
-
136
-
137
-
138
-
139
-
140
-
141
-
142
-
143
-
144
-
145
-
146
-
147
-
148
-
149
-
150
-
151
-
152
-
153
-
154
-
155
-
156
-
157
-
158
-
159
-
160
-
161
-
162
-
163
-
164
-
165
-
166
-
167
-
168
-
169
-
170
-
171
-
172
-
173
-
174
 |
 |

energy, telecommunications, technology, employee benefits, food and beverage, furniture, fixtures and equipment
and operating supplies. We feel we are well-positioned for significant growth based on our headcount. We currently
have approximately half of the base of rooms compared to our major competitors, and as a result, as we increase our
room count, our economies of scale should provide a favorable impact to our operations given our existing cost
structure.
Diversification of Cash Flow and Assets. Management believes that the diversity of our brands, market
segments served, revenue sources and geographic locations provide a broad base from which to enhance revenue
and profits and to strengthen our global brands. This diversity limits our exposure to any particular lodging or
vacation ownership asset, brand or geographic region.
While we focus on the luxury and upscale portion of the full-service lodging, vacation ownership and
residential markets, our brands cater to a diverse group of sub-markets within this market. For example, the St.
Regis hotels cater to high-end hotel and resort clientele while Four Points by Sheraton hotels deliver extensive
amenities and services at more affordable rates. The aloft brand will provide a youthful alternative to the
“commodity lodging” of currently existing brands in the select-service market segment, and the Element brand
will provide modern, upscale hotels for extended stay travel.
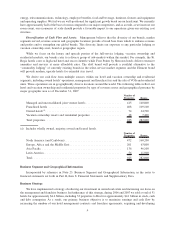
We derive our cash flow from multiple sources within our hotel and vacation ownership and residential
segments, including owned hotels’ operations, management and franchise fees and the sale of VOIs and residential
units. These operations are in geographically diverse locations around the world. The following tables reflect our
hotel and vacation ownership and residential properties by type of revenue source and geographical presence by
major geographic area as of December 31, 2007:
Number of
Properties Rooms
Managed and unconsolidated joint venture hotels ...................... 415 140,800
Franchised hotels ............................................. 408 109,100
Owned hotels
(a)
............................................... 74 24,700
Vacation ownership resorts and residential properties ................... 28 7,400
Total properties ............................................... 925 282,000
(a) Includes wholly owned, majority owned and leased hotels.
Number of
Properties Rooms
North America (and Caribbean) ................................... 472 160,200
Europe, Africa and the Middle East ................................ 261 63,800
Asia Pacific ................................................. 136 46,100
Latin America................................................ 56 11,900
Total....................................................... 925 282,000
Business Segment and Geographical Information
Incorporated by reference in Note 23. Business Segment and Geographical Information, in the notes to
financial statements set forth in Part II, Item 8. Financial Statements and Supplementary Data.
Business Strategy
We have implemented a strategy of reducing our investment in owned real estate and increasing our focus on
the management and franchise business. In furtherance of this strategy, during 2006 and 2007 we sold a total of 51
hotels for approximately $4.6 billion, including 33 properties to Host for approximately $4.1 billion in stock, cash
and debt assumption. As a result, our primary business objective is to maximize earnings and cash flow by
increasing the number of our hotel management contracts and franchise agreements; acquiring and developing
4