Starwood 2007 Annual Report Download - page 160
Download and view the complete annual report
Please find page 160 of the 2007 Starwood annual report below. You can navigate through the pages in the report by either clicking on the pages listed below, or by using the keyword search tool below to find specific information within the annual report.-
 1
1 -
2
-
3
-
4
-
5
-
6
-
7
-
8
-
9
-
10
-
11
-
12
-
13
-
14
-
15
-
16
-
17
-
18
-
19
-
20
-
21
-
22
-
23
-
24
-
25
-
26
-
27
-
28
-
29
-
30
-
31
-
32
-
33
-
34
-
35
-
36
-
37
-
38
-
39
-
40
-
41
-
42
-
43
-
44
-
45
-
46
-
47
-
48
-
49
-
50
-
51
-
52
-
53
-
54
-
55
-
56
-
57
-
58
-
59
-
60
-
61
-
62
-
63
-
64
-
65
-
66
-
67
-
68
-
69
-
70
-
71
-
72
-
73
-
74
-
75
-
76
-
77
-
78
-
79
-
80
-
81
-
82
-
83
-
84
-
85
-
86
-
87
-
88
-
89
-
90
-
91
-
92
-
93
-
94
-
95
-
96
-
97
-
98
-
99
-
100
-
101
-
102
-
103
-
104
-
105
-
106
-
107
-
108
-
109
-
110
-
111
-
112
-
113
-
114
-
115
-
116
-
117
-
118
-
119
-
120
-
121
-
122
-
123
-
124
-
125
-
126
-
127
-
128
-
129
-
130
-
131
-
132
-
133
-
134
-
135
-
136
-
137
-
138
-
139
-
140
-
141
-
142
-
143
-
144
-
145
-
146
-
147
-
148
-
149
-
 150
150 -
 151
151 -
 152
152 -
 153
153 -
 154
154 -
 155
155 -
 156
156 -
 157
157 -
 158
158 -
 159
159 -
 160
160 -
 161
161 -
 162
162 -
 163
163 -
 164
164 -
 165
165 -
 166
166 -
 167
167 -
 168
168 -
 169
169 -
 170
170 -
171
-
172
-
173
-
174
 |
 |

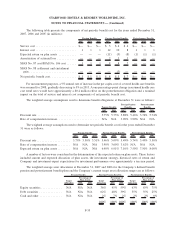
(1) For option activity prior to the consummation of the first phase of the Host Transaction on April 10, 2006, the
adjustment made to the exercise price in connection with the Host Transaction is not reflected.
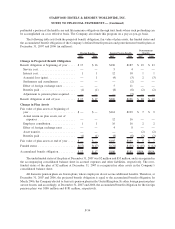
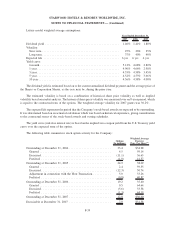
The weighted-average fair value per option for options granted during 2007, 2006 and 2005 was $20.54,
$16.12 and $17.23, respectively, and the service period is typically four years. The total intrinsic value of options
exercised during 2007, 2006 and 2005 was approximately $187 million, $370 million and $257 million, respec-
tively, resulting in tax benefits of approximately $56 million, $128 million and $88 million, respectively. As of
December 31, 2007, there was approximately $23 million of unrecognized compensation cost, net of estimated
forfeitures, related to nonvested options, which is expected to be recognized over a weighted-average period of
1.04 years on a straight-line basis for 2007 and future grants and using an accelerated recognition method for grants
prior to January 1, 2007.
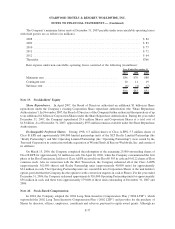
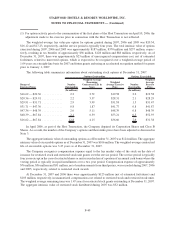
The following table summarizes information about outstanding stock options at December 31, 2007:
Range of
Exercise Prices
Number
Outstanding
Weighted Average
Remaining
Contractual Life in
Years
Weighted
Average Exercise
Price
Number
Exercisable
Weighted
Average
Exercise
Price
Options Outstanding Options Exercisable
(In millions) (In millions)
$16.62 — $20.36 ............. 2.2 2.72 $19.58 2.2 $19.58
$20.36 — $29.91 ............. 2.2 3.37 $28.31 2.1 $28.29
$29.91 — $31.71 ............. 2.9 3.99 $31.58 1.5 $31.47
$31.71 — $47.36 ............. 0.8 1.87 $41.77 0.8 $41.87
$47.36 — $48.39 ............. 2.6 5.11 $48.39 0.8 $48.39
$48.39 — $67.84 ............. 2.1 6.39 $53.21 0.5 $52.93
$16.62 — $67.84 ............. 12.8 4.15 $36.60 7.9 $31.38
In April 2006, as part of the Host Transaction, the Company depaired its Corporation Shares and Class B
Shares. As a result, the number of the Company’s options and their strike prices have been adjusted as discussed in
Note 3.
The aggregate intrinsic value of outstanding options as of December 31, 2007 was $124 million. The aggregate
intrinsic value of exercisable options as of December 31, 2007 was $106 million. The weighted-average contractual
life of exercisable options was 3.47 years as of December 31, 2007.
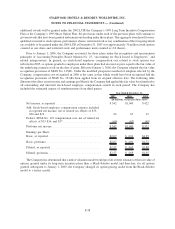
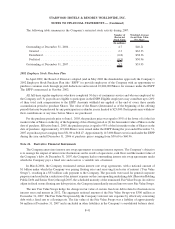
The Company recognizes compensation expense equal to the fair market value of the stock on the date of
issuance for restricted stock and restricted stock unit grants over the service period. The service period is typically
four years except in the case of restricted shares or units issued in lieu of a portion of an annual cash bonus where the
vesting period is typically in equal installments over a two year period. Compensation expense of approximately
$76 million, $56 million and $31 million, net of reimbursements from third parties, was recorded during 2007, 2006
and 2005, respectively, related to restricted stock awards.
At December 31, 2007 and 2006 there were approximately $125 million (net of estimated forfeitures) and
$103 million, respectively, in unamortized compensation cost related to restricted stock and restricted stock units.
The weighted average remaining term was 1.47 years for restricted stock grants outstanding at December 31, 2007.
The aggregate intrinsic value of restricted stock distributed during 2007 was $52 million.
F-40
STARWOOD HOTELS & RESORTS WORLDWIDE, INC.
NOTES TO FINANCIAL STATEMENTS — (Continued)