Sears 2011 Annual Report Download - page 86
Download and view the complete annual report
Please find page 86 of the 2011 Sears annual report below. You can navigate through the pages in the report by either clicking on the pages listed below, or by using the keyword search tool below to find specific information within the annual report.-
 1
1 -
2
-
3
-
4
-
5
-
6
-
7
-
8
-
9
-
10
-
11
-
12
-
13
-
14
-
15
-
16
-
17
-
18
-
19
-
20
-
21
-
22
-
23
-
24
-
25
-
26
-
27
-
28
-
29
-
30
-
31
-
32
-
33
-
34
-
35
-
36
-
37
-
38
-
39
-
40
-
41
-
42
-
43
-
44
-
45
-
46
-
47
-
48
-
49
-
50
-
51
-
52
-
53
-
54
-
55
-
56
-
57
-
58
-
59
-
60
-
61
-
62
-
63
-
64
-
65
-
66
-
67
-
68
-
69
-
70
-
71
-
72
-
73
-
74
-
75
-
 76
76 -
 77
77 -
 78
78 -
 79
79 -
 80
80 -
 81
81 -
 82
82 -
 83
83 -
 84
84 -
 85
85 -
 86
86 -
 87
87 -
 88
88 -
 89
89 -
 90
90 -
 91
91 -
 92
92 -
 93
93 -
 94
94 -
 95
95 -
 96
96 -
97
-
98
-
99
-
100
-
101
-
102
-
103
-
104
-
105
-
106
-
107
-
108
-
109
-
110
-
111
-
112
-
113
-
114
-
115
-
116
-
117
-
118
-
119
-
120
-
121
-
122
 |
 |

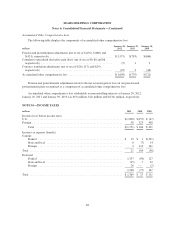
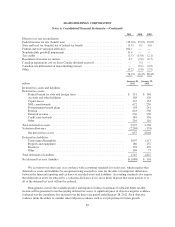
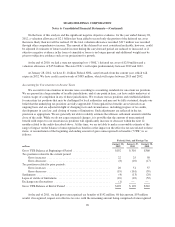
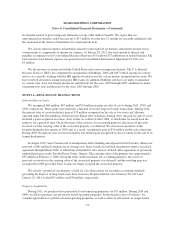
SEARS HOLDINGS CORPORATION
Notes to Consolidated Financial Statements—(Continued)
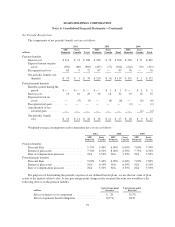
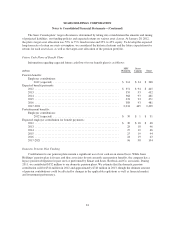
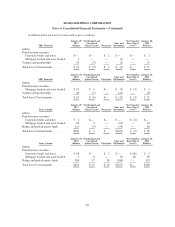
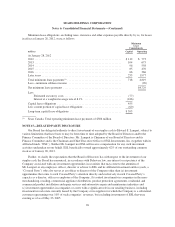
NOTE 8—EARNINGS PER SHARE
The following tables set forth the components used to calculate basic and diluted earnings (loss) per share
from continuing operation. Restricted stock awards for 2011 were not included in the computation of diluted
earnings (loss) per share from continuing operations because the effect of their inclusion would have been
antidilutive.
millions except earnings per share 2011 2010 2009
Basic weighted average shares ................................ 106.8 111.5 117.8
Dilutive effect of restricted stock and stock options ................ — 0.2 0.1
Diluted weighted average shares .............................. 106.8 111.7 117.9
Net income (loss) from continuing operations attributable to Holdings’
shareholders ............................................ $(3,113) $ 122 $ 218
Earnings (loss) per share from continuing operations attributable to
Holdings’ shareholders
Basic ................................................ $(29.15) $ 1.09 $ 1.85
Diluted ............................................... $(29.15) $ 1.09 $ 1.85
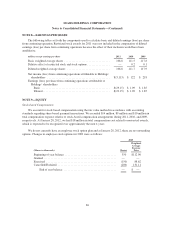
NOTE 9—EQUITY
Stock-based Compensation
We account for stock-based compensation using the fair value method in accordance with accounting
standards regarding share-based payment transactions. We recorded $14 million, $9 million and $10 million in
total compensation expense relative to stock-based compensation arrangements during 2011, 2010, and 2009,
respectively. At January 28, 2012, we had $18 million in total compensation cost related to nonvested awards,
which is expected to be recognized over approximately the next 4 years.
We do not currently have an employee stock option plan and at January 28, 2012, there are no outstanding
options. Changes in employee stock options for 2009 were as follows:
2009
(Shares in thousands) Shares
Weighted-
Average
Exercise
Price
Beginning of year balance .................................... 350 $112.90
Granted ................................................... — —
Exercised ................................................. (150) 88.62
Cancelled/Forfeited ......................................... (200) 131.11
End of year balance ..................................... — $ —
86