Sears 2011 Annual Report Download - page 25
Download and view the complete annual report
Please find page 25 of the 2011 Sears annual report below. You can navigate through the pages in the report by either clicking on the pages listed below, or by using the keyword search tool below to find specific information within the annual report.-
 1
1 -
2
-
3
-
4
-
5
-
6
-
7
-
8
-
9
-
10
-
11
-
12
-
13
-
14
-
 15
15 -
 16
16 -
 17
17 -
 18
18 -
 19
19 -
 20
20 -
 21
21 -
 22
22 -
 23
23 -
 24
24 -
 25
25 -
 26
26 -
 27
27 -
 28
28 -
 29
29 -
 30
30 -
 31
31 -
 32
32 -
 33
33 -
 34
34 -
 35
35 -
36
-
37
-
38
-
39
-
40
-
41
-
42
-
43
-
44
-
45
-
46
-
47
-
48
-
49
-
50
-
51
-
52
-
53
-
54
-
55
-
56
-
57
-
58
-
59
-
60
-
61
-
62
-
63
-
64
-
65
-
66
-
67
-
68
-
69
-
70
-
71
-
72
-
73
-
74
-
75
-
76
-
77
-
78
-
79
-
80
-
81
-
82
-
83
-
84
-
85
-
86
-
87
-
88
-
89
-
90
-
91
-
92
-
93
-
94
-
95
-
96
-
97
-
98
-
99
-
100
-
101
-
102
-
103
-
104
-
105
-
106
-
107
-
108
-
109
-
110
-
111
-
112
-
113
-
114
-
115
-
116
-
117
-
118
-
119
-
120
-
121
-
122
 |
 |

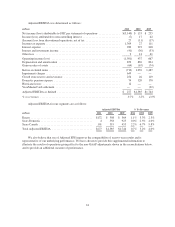
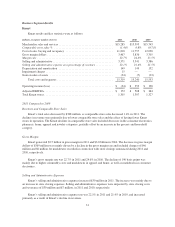
The following tables set forth results of operations on a GAAP and “As Adjusted” basis, as well as the impact
each significant item used in calculating Adjusted EBITDA had on specific income and expense amounts reported in
our Consolidated Statements of Operations during the years 2011, 2010 and 2009.
52 Weeks Ended January 28, 2012
millions, except per
share data GAAP
Domestic
Pension
Expense
Closed Store
Reserve
and
Severance
Mark-to-Market
Losses
Gain on
Sales of
Assets
Hurricane
Losses
Goodwill
Impairment
Tax
Matters
Discontinued
Operations
As
Adjusted
Cost of sales, buying and
occupancy impact ......$30,966 $ — $(130) $ — $ — $ — $ — $ — $ — $30,836
Selling and administrative
impact ............... 10,664 (74) (124) — (12) — — — 10,454
Depreciation and
amortization impact ..... 853 — (8) — — — — — — 845
Impairment charges
impact ............... 649 — (98) — — — (551) — — —
Gain on sales of assets
impact ............... (64) — — — 33 — — — — (31)
Operating income (loss)
impact ............... (1,501) 74 360 — (33) 12 551 — — (537)
Other loss impact ......... (2) — — 6 — — — — — 4
Income tax expense
impact ............... (1,369) (28) (134) (2) 13 (5) — 1,819 — 294
Income (loss) from
discontinued operations,
net of tax, impact ....... (27) — — — — — — — 27 —
(Income) loss attributable to
noncontrolling interest
impact ............... 7 — (1) (1) — — — — — 5
After tax and noncontrolling
interest impact ......... (3,140) 46 225 3 (20) 7 551 1,819 27 (482)
Diluted loss per share
impact ...............$(29.40) $0.43 $2.10 $0.03 $(0.19) $0.07 $5.16 $17.03 $0.25 $ (4.52)
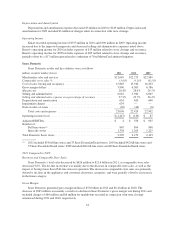
52 Weeks Ended January 29, 2011
millions, except per
share data GAAP
Domestic
Pension
Expense
Closed Store
Reserve
and
Severance
Mark-to-Market
Losses
Gain on
Sales
of Real
Estate
Canadian
Dividend Tax
Impact
Tax
Matters
Discontinued
Operations
As
Adjusted
Cost of sales, buying and
occupancy impact ....... $31,000 $ — $ (12) $ — $ — $ — $ — $ — $30,988
Selling and administrative
impact ................ 10,425 (120) (14) — — — — — 10,291
Depreciation and
amortization impact ..... 869 — (10) — — — — — 859
Gain on sales of assets
impact ................ (67) — — — 35 — — — (32)
Operating income impact . . . 437 120 36 — (35) — — — 558
Other loss impact ......... (14) — — 6 — — — — (8)
Income tax expense
impact ................ (27) (24) (6) (1) 7 9 (13) — (55)
Income from discontinued
operations, net of tax,
impact ................ 11 — (11) —
(Income) loss attributable to
noncontrolling interest
impact ................ (17) — — (1) — — — — (18)
After tax and noncontrolling
interest impact ......... 133 96 30 4 (28) 9 (13) (11) 220
Diluted income per share
impact ................ $ 1.19 $0.86 $0.27 $0.04 $(0.25) $0.08 $(0.12) $(0.10) $ 1.97
25