Sears 2011 Annual Report Download - page 22
Download and view the complete annual report
Please find page 22 of the 2011 Sears annual report below. You can navigate through the pages in the report by either clicking on the pages listed below, or by using the keyword search tool below to find specific information within the annual report.-
 1
1 -
2
-
3
-
4
-
5
-
6
-
7
-
8
-
9
-
10
-
11
-
 12
12 -
 13
13 -
 14
14 -
 15
15 -
 16
16 -
 17
17 -
 18
18 -
 19
19 -
 20
20 -
 21
21 -
 22
22 -
 23
23 -
 24
24 -
 25
25 -
 26
26 -
 27
27 -
 28
28 -
 29
29 -
 30
30 -
 31
31 -
 32
32 -
33
-
34
-
35
-
36
-
37
-
38
-
39
-
40
-
41
-
42
-
43
-
44
-
45
-
46
-
47
-
48
-
49
-
50
-
51
-
52
-
53
-
54
-
55
-
56
-
57
-
58
-
59
-
60
-
61
-
62
-
63
-
64
-
65
-
66
-
67
-
68
-
69
-
70
-
71
-
72
-
73
-
74
-
75
-
76
-
77
-
78
-
79
-
80
-
81
-
82
-
83
-
84
-
85
-
86
-
87
-
88
-
89
-
90
-
91
-
92
-
93
-
94
-
95
-
96
-
97
-
98
-
99
-
100
-
101
-
102
-
103
-
104
-
105
-
106
-
107
-
108
-
109
-
110
-
111
-
112
-
113
-
114
-
115
-
116
-
117
-
118
-
119
-
120
-
121
-
122
 |
 |

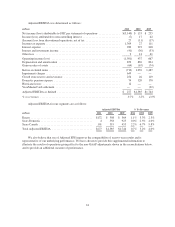
Holdings’ Consolidated Results
Holdings’ consolidated results of operations for 2011, 2010 and 2009 are summarized as follows:
millions, except per share data 2011 2010 2009
REVENUES
Merchandise sales and services ........................................ $41,567 $42,664 $43,360
COSTS AND EXPENSES
Cost of sales, buying and occupancy .................................... 30,966 31,000 31,374
Gross margin dollars ................................................ 10,601 11,664 11,986
Margin rate ....................................................... 25.5% 27.3% 27.6%
Selling and administrative ............................................ 10,664 10,425 10,499
Selling and administrative expense as a percentage of revenues .............. 25.7% 24.4% 24.2%
Depreciation and amortization ......................................... 853 869 894
Impairment charges ................................................. 649 — —
Gain on sales of assets ............................................... (64) (67) (74)
Total costs and expenses ......................................... 43,068 42,227 42,693
Operating income (loss) .............................................. (1,501) 437 667
Interest expense .................................................... (289) (293) (248)
Interest and investment income ........................................ 41 36 33
Other loss ......................................................... (2) (14) (61)
Income (loss) from continuing operations before income taxes ............... (1,751) 166 391
Income tax expense ................................................. (1,369) (27) (111)
Income (loss) from continuing operations ................................ (3,120) 139 280
Income (loss) from discontinued operations, net of tax ...................... (27) 11 17
Net income (loss) ................................................... (3,147) 150 297
(Income) loss attributable to noncontrolling interests ....................... 7 (17) (62)
NET INCOME (LOSS) ATTRIBUTABLE TO HOLDINGS’
SHAREHOLDERS ............................................... $(3,140) $ 133 $ 235
Amounts attributable to Holdings’ shareholders:
Income (loss) from continuing operations, net of tax ....................... $(3,113) $ 122 $ 218
Income (loss) from discontinued operations, net of tax ...................... (27) 11 17
Net income (loss) ................................................... $(3,140) $ 133 $ 235
NET INCOME (LOSS) PER COMMON SHARE ATTRIBUTABLE TO
HOLDINGS’ SHAREHOLDERS
Diluted:
Continuing operations ............................................... $(29.15) $ 1.09 $ 1.85
Discontinued operations .............................................. (0.25) 0.10 0.14
$ (29.40) $ 1.19 $ 1.99
Diluted weighted average common shares outstanding ...................... 106.8 111.7 117.9
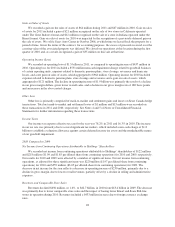
References to comparable store sales amounts within the following discussion include sales for all stores
operating for a period of at least 12 full months, including remodeled and expanded stores, but excluding store
relocations and stores that have undergone format changes. Comparable store sales results for 2011 were
calculated based on the 52-week period ended January 28, 2012.
Beginning with the first quarter of 2011, we now include in comparable store sales online sales from
sears.com and kmart.com shipped directly to customers. These online sales increased 16% for 2011 compared to
22