Sears 2011 Annual Report Download - page 101
Download and view the complete annual report
Please find page 101 of the 2011 Sears annual report below. You can navigate through the pages in the report by either clicking on the pages listed below, or by using the keyword search tool below to find specific information within the annual report.-
 1
1 -
2
-
3
-
4
-
5
-
6
-
7
-
8
-
9
-
10
-
11
-
12
-
13
-
14
-
15
-
16
-
17
-
18
-
19
-
20
-
21
-
22
-
23
-
24
-
25
-
26
-
27
-
28
-
29
-
30
-
31
-
32
-
33
-
34
-
35
-
36
-
37
-
38
-
39
-
40
-
41
-
42
-
43
-
44
-
45
-
46
-
47
-
48
-
49
-
50
-
51
-
52
-
53
-
54
-
55
-
56
-
57
-
58
-
59
-
60
-
61
-
62
-
63
-
64
-
65
-
66
-
67
-
68
-
69
-
70
-
71
-
72
-
73
-
74
-
75
-
76
-
77
-
78
-
79
-
80
-
81
-
82
-
83
-
84
-
85
-
86
-
87
-
88
-
89
-
90
-
 91
91 -
 92
92 -
 93
93 -
 94
94 -
 95
95 -
 96
96 -
 97
97 -
 98
98 -
 99
99 -
 100
100 -
 101
101 -
 102
102 -
 103
103 -
 104
104 -
 105
105 -
 106
106 -
 107
107 -
 108
108 -
 109
109 -
 110
110 -
 111
111 -
112
-
113
-
114
-
115
-
116
-
117
-
118
-
119
-
120
-
121
-
122
 |
 |

SEARS HOLDINGS CORPORATION
Notes to Consolidated Financial Statements—(Continued)
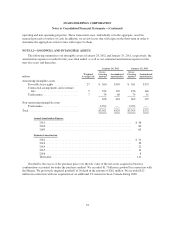
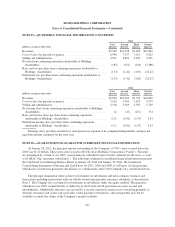
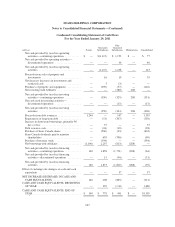
NOTE 19—QUARTERLY FINANCIAL INFORMATION (UNAUDITED)
2011
millions, except per share data
First
Quarter
Second
Quarter
Third
Quarter
Fourth
Quarter
Revenues .................................................. $9,540 $10,138 $9,405 $12,484
Cost of sales, buying and occupancy ............................ 6,996 7,537 7,011 9,422
Selling and administrative ..................................... 2,507 2,601 2,635 2,921
Net loss from continuing operations attributable to Holdings’
shareholders .............................................. (165) (152) (410) (2,386)
Basic net loss per share from continuing operations attributable to
Holdings’ shareholders ..................................... (1.53) (1.42) (3.85) (22.47)
Diluted net loss per share from continuing operations attributable to
Holdings’ shareholders ..................................... (1.53) (1.42) (3.85) (22.47)
2010
millions, except per share data
First
Quarter
Second
Quarter
Third
Quarter
Fourth
Quarter
Revenues .................................................. $9,876 $10,263 $9,523 $13,002
Cost of sales, buying and occupancy ............................ 7,103 7,503 7,015 9,379
Selling and administrative ..................................... 2,516 2,569 2,591 2,749
Net income (loss) from continuing operations attributable to Holdings’
shareholders .............................................. 12 (47) (217) 374
Basic net income (loss) per share from continuing operations
attributable to Holdings’ shareholders ......................... 0.11 (0.42) (1.97) 3.43
Diluted net income (loss) per share from continuing operations
attributable to Holdings’ shareholders ......................... 0.11 (0.42) (1.97) 3.43
Earnings (loss) per share amounts for each quarter are required to be computed independently and may not
equal the amount computed for the total year.
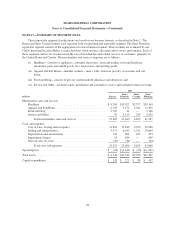
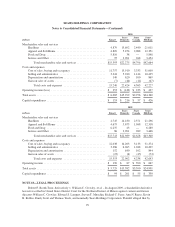
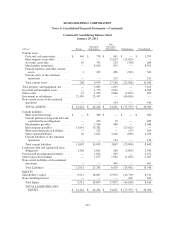
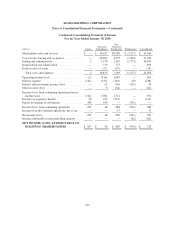
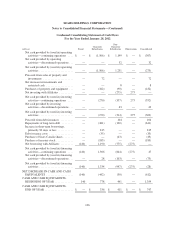
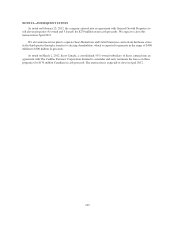
NOTE 20—GUARANTOR/NON-GUARANTOR SUBSIDIARY FINANCIAL INFORMATION
At January 28, 2012, the principal amount outstanding of the Company’s 6 5/8% senior secured notes due
2018 was $1.24 billion. These notes were issued in 2010 by Sears Holdings Corporation (“Parent”). The notes
are guaranteed by certain of our 100% owned domestic subsidiaries that own the collateral for the notes, as well
as by SRAC (the “guarantor subsidiaries”). The following condensed consolidated financial information presents
the Condensed Consolidating Balance Sheets at January 28, 2012 and January 29, 2011, the Condensed
Consolidating Statements of Income and Cash Flows for 2011, 2010 and 2009 of (i) Parent; (ii) the guarantor
subsidiaries; (iii) the non-guarantor subsidiaries; (iv) eliminations and (v) the Company on a consolidated basis.
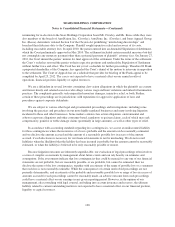
The principal elimination entries relate to investments in subsidiaries and inter-company balances and
transactions including transactions with our wholly-owned non-guarantor insurance subsidiary as described in
Note 3. The Company has accounted for investments in subsidiaries under the equity method. The guarantor
subsidiaries are 100% owned directly or indirectly by the Parent and all guarantees are joint, several and
unconditional. Additionally, the notes are secured by a security interest in certain assets consisting primarily of
domestic inventory and credit card receivables of the guarantor subsidiaries, and consequently may not be
available to satisfy the claims of the Company’s general creditors.
101