Sears 2011 Annual Report Download - page 31
Download and view the complete annual report
Please find page 31 of the 2011 Sears annual report below. You can navigate through the pages in the report by either clicking on the pages listed below, or by using the keyword search tool below to find specific information within the annual report.-
 1
1 -
2
-
3
-
4
-
5
-
6
-
7
-
8
-
9
-
10
-
11
-
12
-
13
-
14
-
15
-
16
-
17
-
18
-
19
-
20
-
 21
21 -
 22
22 -
 23
23 -
 24
24 -
 25
25 -
 26
26 -
 27
27 -
 28
28 -
 29
29 -
 30
30 -
 31
31 -
 32
32 -
 33
33 -
 34
34 -
 35
35 -
 36
36 -
 37
37 -
 38
38 -
 39
39 -
 40
40 -
 41
41 -
42
-
43
-
44
-
45
-
46
-
47
-
48
-
49
-
50
-
51
-
52
-
53
-
54
-
55
-
56
-
57
-
58
-
59
-
60
-
61
-
62
-
63
-
64
-
65
-
66
-
67
-
68
-
69
-
70
-
71
-
72
-
73
-
74
-
75
-
76
-
77
-
78
-
79
-
80
-
81
-
82
-
83
-
84
-
85
-
86
-
87
-
88
-
89
-
90
-
91
-
92
-
93
-
94
-
95
-
96
-
97
-
98
-
99
-
100
-
101
-
102
-
103
-
104
-
105
-
106
-
107
-
108
-
109
-
110
-
111
-
112
-
113
-
114
-
115
-
116
-
117
-
118
-
119
-
120
-
121
-
122
 |
 |

Business Segment Results
Kmart
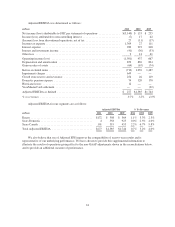
Kmart results and key statistics were as follows:
millions, except for number of stores 2011 2010 2009
Merchandise sales and services ...................................... $15,285 $15,593 $15,743
Comparable store sales % ......................................... (1.4)% 0.8% (0.7)%
Cost of sales, buying and occupancy ................................. 11,818 11,757 12,038
Gross margin dollars .............................................. 3,467 3,836 3,705
Margin rate ..................................................... 22.7% 24.6% 23.5%
Selling and administrative .......................................... 3,371 3,341 3,386
Selling and administrative expense as a percentage of revenues ............ 22.1% 21.4% 21.5%
Depreciation and amortization ...................................... 149 149 152
Impairment charges ............................................... 15 — —
Gain on sales of assets ............................................ (34) (7) (23)
Total costs and expenses ....................................... 15,319 15,240 15,553
Operating income (loss) ........................................... $ (34) $ 353 $ 190
Adjusted EBITDA ................................................ $ 172 $ 508 $ 364
Total Kmart stores ................................................ 1,305 1,307 1,327
2011 Compared to 2010
Revenues and Comparable Store Sales
Kmart’s total sales decreased by $308 million, as comparable store sales decreased 1.4% in 2011. The
declines in revenue were primarily due to lower comparable store sales and the effect of having fewer Kmart
stores in operation. The Kmart declines in comparable store sales included decreases in the consumer electronics,
pharmacy, home, apparel and jewelry categories, partially offset by an increase in the grocery and household
category.
Gross Margin
Kmart generated $3.5 billion in gross margin in 2011 and $3.8 billion in 2010. The decrease in gross margin
dollars of $369 million was mainly driven by a decline in the gross margin rate and included charges of $46
million and $6 million for markdowns recorded in connection with store closings announced during 2011 and
2010, respectively.
Kmart’s gross margin rate was 22.7% in 2011 and 24.6% in 2010. The decline of 190 basis points was
mainly due to higher commodity costs and markdowns in apparel and home, as well as markdowns in consumer
electronics.
Selling and Administrative Expenses
Kmart’s selling and administrative expenses increased $30 million in 2011. The increase was mainly due to
an increase in store closing expenses. Selling and administrative expenses were impacted by store closing costs
and severance of $30 million and $7 million, in 2011 and 2010, respectively.
Kmart’s selling and administrative expense rate was 22.1% in 2011 and 21.4% in 2010, and increased
primarily as a result of Kmart’s decline in revenues.
31