Sears 2011 Annual Report Download - page 36
Download and view the complete annual report
Please find page 36 of the 2011 Sears annual report below. You can navigate through the pages in the report by either clicking on the pages listed below, or by using the keyword search tool below to find specific information within the annual report.-
 1
1 -
2
-
3
-
4
-
5
-
6
-
7
-
8
-
9
-
10
-
11
-
12
-
13
-
14
-
15
-
16
-
17
-
18
-
19
-
20
-
21
-
22
-
23
-
24
-
25
-
 26
26 -
 27
27 -
 28
28 -
 29
29 -
 30
30 -
 31
31 -
 32
32 -
 33
33 -
 34
34 -
 35
35 -
 36
36 -
 37
37 -
 38
38 -
 39
39 -
 40
40 -
 41
41 -
 42
42 -
 43
43 -
 44
44 -
 45
45 -
 46
46 -
47
-
48
-
49
-
50
-
51
-
52
-
53
-
54
-
55
-
56
-
57
-
58
-
59
-
60
-
61
-
62
-
63
-
64
-
65
-
66
-
67
-
68
-
69
-
70
-
71
-
72
-
73
-
74
-
75
-
76
-
77
-
78
-
79
-
80
-
81
-
82
-
83
-
84
-
85
-
86
-
87
-
88
-
89
-
90
-
91
-
92
-
93
-
94
-
95
-
96
-
97
-
98
-
99
-
100
-
101
-
102
-
103
-
104
-
105
-
106
-
107
-
108
-
109
-
110
-
111
-
112
-
113
-
114
-
115
-
116
-
117
-
118
-
119
-
120
-
121
-
122
 |
 |

Sears Canada
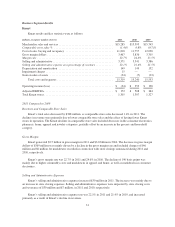
Sears Canada, a consolidated, 95%-owned subsidiary of Sears, conducts similar retail operations as Sears
Domestic. Sears Canada results and key statistics were as follows:
millions, except for number of stores 2011 2010 2009
Merchandise sales and services ........................................ $4,633 $4,796 $4,628
Comparable store sales % ............................................ (7.7)% (4.0)% (6.9)%
Cost of sales, buying and occupancy .................................... 3,299 3,333 3,133
Gross margin dollars ................................................ 1,334 1,463 1,495
Margin rate ....................................................... 28.8% 30.5% 32.3%
Selling and administrative ............................................ 1,251 1,144 1,048
Selling and administrative expense as a percentage of revenues .............. 27.0% 23.9% 22.6%
Depreciation and amortization ......................................... 103 100 102
Gain on sales of assets ............................................... — (14) (45)
Total costs and expenses ......................................... 4,653 4,563 4,238
Operating income (loss) .............................................. $ (20) $ 233 $ 390
Adjusted EBITDA .................................................. $ 101 $ 319 $ 455
Number of:
Full-line stores ................................................. 122 122 122
Specialty stores ................................................ 378 361 280
Total Sears Canada stores ............................................ 500 483 402
2011 Compared to 2010
Revenues and Comparable Store Sales
Sears Canada’s revenues decreased by $163 million in 2011 to $4.6 billion and included a $171 million
increase due to the impact of exchange rates. On a Canadian dollar basis, revenues decreased by $334 million,
due to a 7.7% decline in comparable store sales primarily attributable to sales declines in the hardlines and home
categories, with industry-wide price compression and aggressive competition affecting sales in major appliances,
electronics and home décor products. Revenue in the apparel and accessories categories also experienced
declines primarily in women’s wear and men’s wear.
Gross Margin
Total gross margin dollars decreased $129 million to $1.3 billion for 2011 and included a $51 million
increase due to the impact of exchange rates. Gross margin decreased $180 million on a Canadian dollar basis
primarily as a result of a decline in gross margin rate. Sears Canada’s margin rate decreased 170 basis points to
28.8% in 2011, from 30.5% in 2010, as a result of clearing inventory, due to an enhanced focus on improving
inventory productivity.
Selling and Administrative Expenses
Sears Canada’s selling and administrative expenses increased $107 million to $1.3 billion in 2011, and
included an increase of $42 million due to the impact of exchange rates and severance expenses of $18 million
recorded during 2011. On a Canadian dollar basis, selling and administrative expenses increased by $65 million
primarily due to increased investment in strategic projects and the above noted severance expense.
Sears Canada’s selling and administrative expense rate was 27.0% in 2011 and 23.9% in 2010, and
increased primarily due to the above noted increase in expenses and decrease in sales.
36