Sears 2011 Annual Report Download - page 24
Download and view the complete annual report
Please find page 24 of the 2011 Sears annual report below. You can navigate through the pages in the report by either clicking on the pages listed below, or by using the keyword search tool below to find specific information within the annual report.-
 1
1 -
2
-
3
-
4
-
5
-
6
-
7
-
8
-
9
-
10
-
11
-
12
-
13
-
 14
14 -
 15
15 -
 16
16 -
 17
17 -
 18
18 -
 19
19 -
 20
20 -
 21
21 -
 22
22 -
 23
23 -
 24
24 -
 25
25 -
 26
26 -
 27
27 -
 28
28 -
 29
29 -
 30
30 -
 31
31 -
 32
32 -
 33
33 -
 34
34 -
35
-
36
-
37
-
38
-
39
-
40
-
41
-
42
-
43
-
44
-
45
-
46
-
47
-
48
-
49
-
50
-
51
-
52
-
53
-
54
-
55
-
56
-
57
-
58
-
59
-
60
-
61
-
62
-
63
-
64
-
65
-
66
-
67
-
68
-
69
-
70
-
71
-
72
-
73
-
74
-
75
-
76
-
77
-
78
-
79
-
80
-
81
-
82
-
83
-
84
-
85
-
86
-
87
-
88
-
89
-
90
-
91
-
92
-
93
-
94
-
95
-
96
-
97
-
98
-
99
-
100
-
101
-
102
-
103
-
104
-
105
-
106
-
107
-
108
-
109
-
110
-
111
-
112
-
113
-
114
-
115
-
116
-
117
-
118
-
119
-
120
-
121
-
122
 |
 |

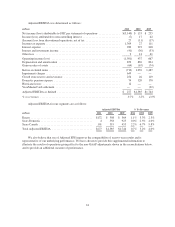
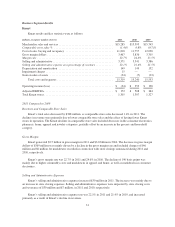
Adjusted EBITDA was determined as follows:
millions 2011 2010 2009
Net income (loss) attributable to SHC per statement of operations ............... $(3,140) $ 133 $ 235
Income (loss) attributable to noncontrolling interest .......................... (7) 17 62
(Income) loss from discontinued operations, net of tax ........................ 27 (11) (17)
Income tax expense .................................................... 1,369 27 111
Interest expense ....................................................... 289 293 248
Interest and investment income .......................................... (41) (36) (33)
Other loss ........................................................... 2 14 61
Operating income (loss) ................................................ (1,501) 437 667
Depreciation and amortization ........................................... 853 869 894
Gain on sales of assets ................................................. (64) (67) (74)
Before excluded items .................................................. (712) 1,239 1,487
Impairment charges .................................................... 649 — —
Closed store reserve and severance ....................................... 254 26 119
Domestic pension expense .............................................. 74 120 170
Hurricane losses ...................................................... 12 — —
Visa/MasterCard settlement ............................................. — — (32)
Adjusted EBITDA as defined ............................................ $ 277 $1,385 $1,744
% to revenues ........................................................ 0.7% 3.2% 4.0%
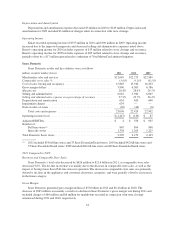
Adjusted EBITDA for our segments are as follows:
Adjusted EBITDA % To Revenues
millions 2011 2010 2009 2011 2010 2009
Kmart ........................................... $172 $ 508 $ 364 1.1% 3.3% 2.3%
Sears Domestic .................................... 4 558 925 0.0% 2.5% 4.0%
Sears Canada ..................................... 101 319 455 2.2% 6.7% 9.8%
Total Adjusted EBITDA ............................ $277 $1,385 $1,744 0.7% 3.2% 4.0%
We also believe that use of Adjusted EPS improves the comparability of year-to-year results and is
representative of our underlying performance. We have chosen to provide this supplemental information to
illustrate the results of operations giving effect to the non-GAAP adjustments shown in the reconciliations below,
and to provide an additional measure of performance.
24