Sears 2011 Annual Report Download - page 33
Download and view the complete annual report
Please find page 33 of the 2011 Sears annual report below. You can navigate through the pages in the report by either clicking on the pages listed below, or by using the keyword search tool below to find specific information within the annual report.-
 1
1 -
2
-
3
-
4
-
5
-
6
-
7
-
8
-
9
-
10
-
11
-
12
-
13
-
14
-
15
-
16
-
17
-
18
-
19
-
20
-
21
-
22
-
 23
23 -
 24
24 -
 25
25 -
 26
26 -
 27
27 -
 28
28 -
 29
29 -
 30
30 -
 31
31 -
 32
32 -
 33
33 -
 34
34 -
 35
35 -
 36
36 -
 37
37 -
 38
38 -
 39
39 -
 40
40 -
 41
41 -
 42
42 -
 43
43 -
44
-
45
-
46
-
47
-
48
-
49
-
50
-
51
-
52
-
53
-
54
-
55
-
56
-
57
-
58
-
59
-
60
-
61
-
62
-
63
-
64
-
65
-
66
-
67
-
68
-
69
-
70
-
71
-
72
-
73
-
74
-
75
-
76
-
77
-
78
-
79
-
80
-
81
-
82
-
83
-
84
-
85
-
86
-
87
-
88
-
89
-
90
-
91
-
92
-
93
-
94
-
95
-
96
-
97
-
98
-
99
-
100
-
101
-
102
-
103
-
104
-
105
-
106
-
107
-
108
-
109
-
110
-
111
-
112
-
113
-
114
-
115
-
116
-
117
-
118
-
119
-
120
-
121
-
122
 |
 |

Depreciation and Amortization
Depreciation and amortization expense decreased $3 million in 2010 to $149 million. Depreciation and
amortization for 2009 included $3 million of charges taken in connection with store closings.
Operating Income
Kmart recorded operating income of $353 million in 2010 and $190 million in 2009. Operating income
increased due to the improved margin rate and decreased selling and administrative expenses noted above.
Kmart’s operating income for 2010 includes expenses of $13 million related to store closings and severance.
Kmart’s operating income for 2009 includes expenses of $65 million related to store closings and severance,
partially offset by a $17 million gain related to settlement of Visa/MasterCard antitrust litigation.
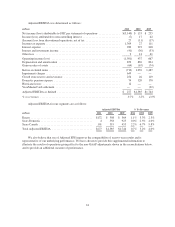
Sears Domestic
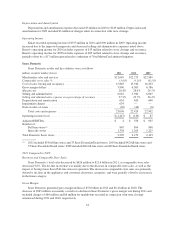
Sears Domestic results and key statistics were as follows:
millions, except for number of stores 2011 2010 2009
Merchandise sales and services ..................................... $21,649 $22,275 $22,989
Comparable store sales % ......................................... (3.0)% (3.1)% (8.1)%
Cost of sales, buying and occupancy ................................. 15,849 15,910 16,203
Gross margin dollars ............................................. 5,800 6,365 6,786
Margin rate .................................................... 26.8% 28.6% 29.5%
Selling and administrative ......................................... 6,042 5,940 6,065
Selling and administrative expense as a percentage of revenues ........... 27.9% 26.7% 26.4%
Depreciation and amortization ...................................... 601 620 640
Impairment charges .............................................. 634 — —
Gain on sales of assets ............................................ (30) (46) (6)
Total costs and expenses ...................................... 23,096 22,424 22,902
Operating income (loss) ........................................... $(1,447) $ (149) $ 87
Adjusted EBITDA ............................................... $ 4 $ 558 $ 925
Number of:
Full-line stores(1) ............................................ 867 894 908
Specialty stores ............................................. 1,338 1,265 1,225
Total Domestic Sears stores ........................................ 2,205 2,159 2,133
(1) 2011 included 834 full-line stores and 33 Sears Essentials/Grand stores; 2010 included 842 full-line stores and
52 Sears Essentials/Grand stores; 2009 included 848 full-line stores and 60 Sears Essentials/Grand stores
2011 Compared to 2010
Revenues and Comparable Store Sales
Sears Domestic’s total sales decreased by $626 million to $21.6 billion in 2011, as comparable store sales
decreased 3.0%. The decline in revenue was mainly due to the decrease in comparable store sales, as well as the
impact of having fewer Sears Full-line stores in operation. The decrease in comparable store sales was primarily
driven by declines in the appliances and consumer electronics categories, and were partially offset by an increase
in the home category.
Gross Margin
Sears Domestic generated gross margin dollars of $5.8 billion in 2011 and $6.4 billion in 2010. The
decrease of $565 million was mainly a result of a decline in Sears Domestic’s gross margin rate during 2011 and
included charges of $84 million and $6 million for markdowns recorded in connection with store closings
announced during 2011 and 2010, respectively.
33