Sears 2011 Annual Report Download - page 28
Download and view the complete annual report
Please find page 28 of the 2011 Sears annual report below. You can navigate through the pages in the report by either clicking on the pages listed below, or by using the keyword search tool below to find specific information within the annual report.-
 1
1 -
2
-
3
-
4
-
5
-
6
-
7
-
8
-
9
-
10
-
11
-
12
-
13
-
14
-
15
-
16
-
17
-
 18
18 -
 19
19 -
 20
20 -
 21
21 -
 22
22 -
 23
23 -
 24
24 -
 25
25 -
 26
26 -
 27
27 -
 28
28 -
 29
29 -
 30
30 -
 31
31 -
 32
32 -
 33
33 -
 34
34 -
 35
35 -
 36
36 -
 37
37 -
 38
38 -
39
-
40
-
41
-
42
-
43
-
44
-
45
-
46
-
47
-
48
-
49
-
50
-
51
-
52
-
53
-
54
-
55
-
56
-
57
-
58
-
59
-
60
-
61
-
62
-
63
-
64
-
65
-
66
-
67
-
68
-
69
-
70
-
71
-
72
-
73
-
74
-
75
-
76
-
77
-
78
-
79
-
80
-
81
-
82
-
83
-
84
-
85
-
86
-
87
-
88
-
89
-
90
-
91
-
92
-
93
-
94
-
95
-
96
-
97
-
98
-
99
-
100
-
101
-
102
-
103
-
104
-
105
-
106
-
107
-
108
-
109
-
110
-
111
-
112
-
113
-
114
-
115
-
116
-
117
-
118
-
119
-
120
-
121
-
122
 |
 |
Gain on Sales of Assets
We recorded a gain on the sales of assets of $64 million during 2011 and $67 million in 2010. Gain on sales
of assets for 2011 included a gain of $21 million recognized on the sale of two stores in California operated
under The Great Indoors format and $12 million recognized on the sale of a store in Indiana operated under the
Kmart format. Gain on sales of assets for 2010 was impacted by the recognition of a previously deferred gain on
the sale of assets. We sold a Sears Auto Center in October 2006, at which time we leased back the property for a
period of time. Given the terms of the contract, for accounting purposes, the excess of proceeds received over the
carrying value of the associated property was deferred. We closed our operations at this location during the first
quarter of 2010 and, as a result, recognized a gain of $35 million on this sale at that time.
Operating Income (Loss)
We recorded an operating loss of $1.5 billion in 2011, as compared to operating income of $437 million in
2010. Operating loss for 2011 included a $551 million non-cash impairment charge related to goodwill balances
of certain reporting units, expenses related to domestic pension plans, store closings, severance and hurricane
losses, and a net gain on sales of assets, which aggregated to $964 million. Operating income for 2010 included
expenses related to domestic pension plans, store closings and severance and a gain on sale of assets, which
aggregated to $121 million. The decline in operating income of $1.9 billion was primarily the result of a decline
in our gross margin dollars, given lower overall sales, and a decline in our gross margin rate of 180 basis points
and an increase in the above noted charges.
Other Loss
Other loss is primarily comprised of mark-to-market and settlement gains and losses on Sears Canada hedge
transactions. Total net mark-to-market and settlement losses of $1 million and $15 million were recorded on
these transactions in 2011 and 2010, respectively. See Notes 4 and 5 of Notes to Consolidated Financial
Statements for further information regarding these transactions.
Income Taxes
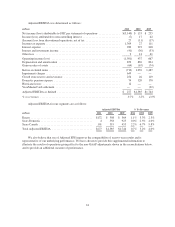
Our income tax expense effective tax rate for the year was 78.2% in 2011 and 16.3% in 2010. The increase
in our tax rate was primarily due to several significant tax matters, which included a non-cash charge of $1.8
billion to establish a valuation allowance against certain deferred income tax assets and the nondeductible nature
of our goodwill impairment.
2010 Compared to 2009
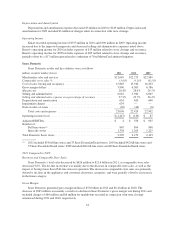
Net Income from Continuing Operations Attributable to Holdings’ Shareholders
We recorded net income from continuing operations attributable to Holdings’ shareholders of $122 million
and $218 million ($1.09 and $1.85 per diluted share from continuing operations) for 2010 and 2009, respectively.
Our results for 2010 and 2009 were affected by a number of significant items. Our net income from continuing
operations, as adjusted for these significant items was $220 million ($1.97 per diluted share from continuing
operations) for 2010 and $359 million ($3.05 per diluted share from continuing operations) for 2009. The
decrease in net income for the year reflects a decrease in operating income of $230 million, primarily due to a
decline in gross margin, due to lower overall revenues, partially offset by a decline in selling and administrative
expenses.
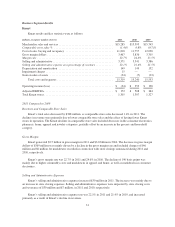
Revenues and Comparable Store Sales
Revenues declined $696 million, or 1.6%, to $42.7 billion, in 2010 from $43.4 billion in 2009. The decrease
was primarily due to lower comparable store sales and the impact of having fewer Kmart and Sears Full-line
stores in operation during 2010. Revenues included a $433 million increase due to foreign currency exchange
rates.
28