Sears 2011 Annual Report Download - page 110
Download and view the complete annual report
Please find page 110 of the 2011 Sears annual report below. You can navigate through the pages in the report by either clicking on the pages listed below, or by using the keyword search tool below to find specific information within the annual report.-
 1
1 -
2
-
3
-
4
-
5
-
6
-
7
-
8
-
9
-
10
-
11
-
12
-
13
-
14
-
15
-
16
-
17
-
18
-
19
-
20
-
21
-
22
-
23
-
24
-
25
-
26
-
27
-
28
-
29
-
30
-
31
-
32
-
33
-
34
-
35
-
36
-
37
-
38
-
39
-
40
-
41
-
42
-
43
-
44
-
45
-
46
-
47
-
48
-
49
-
50
-
51
-
52
-
53
-
54
-
55
-
56
-
57
-
58
-
59
-
60
-
61
-
62
-
63
-
64
-
65
-
66
-
67
-
68
-
69
-
70
-
71
-
72
-
73
-
74
-
75
-
76
-
77
-
78
-
79
-
80
-
81
-
82
-
83
-
84
-
85
-
86
-
87
-
88
-
89
-
90
-
91
-
92
-
93
-
94
-
95
-
96
-
97
-
98
-
99
-
 100
100 -
 101
101 -
 102
102 -
 103
103 -
 104
104 -
 105
105 -
 106
106 -
 107
107 -
 108
108 -
 109
109 -
 110
110 -
 111
111 -
 112
112 -
 113
113 -
 114
114 -
 115
115 -
 116
116 -
 117
117 -
 118
118 -
 119
119 -
 120
120 -
121
-
122
 |
 |

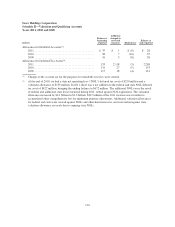
Sears Holdings Corporation
Schedule II—Valuation and Qualifying Accounts
Years 2011, 2010 and 2009
millions
Balance at
beginning
of period
Additions
charged to
costs and
expenses (Deductions)
Balance at
end of period
Allowance for Doubtful Accounts(1):
2011 .......................................... $ 35 $ 1 $ (8) $ 28
2010 .......................................... 38 7 (10) 35
2009 .......................................... 41 5 (8) 38
Allowance for Deferred Tax Assets(2):
2011 .......................................... 153 2,118 (3) 2,268
2010 .......................................... 131 27 (5) 153
2009 .......................................... 117 18 (4) 131
(1) Charges to the account are for the purposes for which the reserves were created.
(2) At the end of 2010, we had a state net operating loss (“NOL”) deferred tax asset of $250 million and a
valuation allowance of $153 million. In 2011, there was a net addition to the federal and state NOL deferred
tax asset of $422 million, bringing the ending balance to $672 million. The additional NOLs were the result
of federal and additional state losses incurred during 2011, netted against NOL expirations. The valuation
allowance increased by $2.1 billion to $2.3 billion. $317 million of the 2011 increase was recorded to
accumulated other comprehensive loss for minimum pension adjustments. Additional valuation allowances
for federal and state were created against NOLs and other deferred assets, and were netted against state
valuation allowance reversals due to expiring state NOLs.
110