Sears 2011 Annual Report Download - page 29
Download and view the complete annual report
Please find page 29 of the 2011 Sears annual report below. You can navigate through the pages in the report by either clicking on the pages listed below, or by using the keyword search tool below to find specific information within the annual report.-
 1
1 -
2
-
3
-
4
-
5
-
6
-
7
-
8
-
9
-
10
-
11
-
12
-
13
-
14
-
15
-
16
-
17
-
18
-
 19
19 -
 20
20 -
 21
21 -
 22
22 -
 23
23 -
 24
24 -
 25
25 -
 26
26 -
 27
27 -
 28
28 -
 29
29 -
 30
30 -
 31
31 -
 32
32 -
 33
33 -
 34
34 -
 35
35 -
 36
36 -
 37
37 -
 38
38 -
 39
39 -
40
-
41
-
42
-
43
-
44
-
45
-
46
-
47
-
48
-
49
-
50
-
51
-
52
-
53
-
54
-
55
-
56
-
57
-
58
-
59
-
60
-
61
-
62
-
63
-
64
-
65
-
66
-
67
-
68
-
69
-
70
-
71
-
72
-
73
-
74
-
75
-
76
-
77
-
78
-
79
-
80
-
81
-
82
-
83
-
84
-
85
-
86
-
87
-
88
-
89
-
90
-
91
-
92
-
93
-
94
-
95
-
96
-
97
-
98
-
99
-
100
-
101
-
102
-
103
-
104
-
105
-
106
-
107
-
108
-
109
-
110
-
111
-
112
-
113
-
114
-
115
-
116
-
117
-
118
-
119
-
120
-
121
-
122
 |
 |
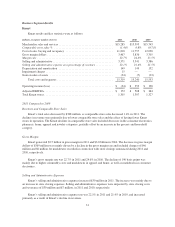
Domestic comparable store sales declined 1.3% in the aggregate, with an increase at Kmart of 0.8% and a
decline at Sears Domestic of 3.1% in 2010. The Kmart improvement was driven by increases in most categories,
with higher increases in the apparel, footwear, jewelry, sporting goods and toys categories, partially offset by
declines in the food and consumables and pharmacy categories. Declines in sales at Sears Domestic were
primarily driven by the hardlines categories, as well as apparel. Over half of the total decline occurred in the
consumer electronics category. In contrast, Sears’ footwear, jewelry and automotive categories generated
comparable store sales growth during the period.
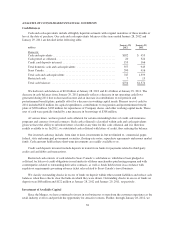
Gross Margin
We generated $11.7 billion in gross margin in 2010 and $12.0 billion in 2009. Gross margin dollars in 2010
included an increase of $142 million related to the impact of foreign currency exchange rates and charges of $12
million for markdowns recorded in connection with store closings announced during 2010. Gross margin for
2009 included a $37 million charge for markdowns recorded in connection with store closings. Gross margin
declined $322 million as compared to the prior year, primarily due to declines in sales and margin rate at Sears
Domestic and Sears Canada, partially offset by an increase in gross margin and margin rate at Kmart.
Sears Domestic’s gross margin rate decreased 90 basis points mainly due to reduced margin rates in home
services and appliances. Sears Canada’s margin rate declined 180 basis points due to price compression in the
appliance and electronics categories, as well as an increase in promotional and clearance markdowns related to a
challenging economic environment. These declines were partially offset by an increase in margin rate of 110
basis points at Kmart, in part as a result of an increase in sales of higher margin categories such as apparel and
sporting goods.
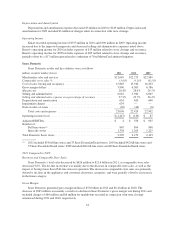
Selling and Administrative Expenses
Our selling and administrative expenses decreased $74 million in 2010 to $10.4 billion and included
incremental expenses of $123 million related to our continued investment in our multi-channel capabilities and
launch of our Shop Your Way Rewards program and an increase of $97 million related to the impact of foreign
currency exchange rates. The decrease includes a $86 million reduction in payroll and benefits expense, a $33
million reduction in advertising expense and a $40 million reduction in insurance expense, as well as reductions
in various other expense categories. Selling and administrative expenses for 2010 were impacted by domestic
pension plan expense of $120 million and store closing costs and severance of $14 million. Selling and
administrative expenses for 2009 were impacted by domestic pension plan expense of $170 million and store
closing costs and severance of $82 million, partially offset by a gain of $32 million recorded in connection with
the settlement of Visa/MasterCard antitrust litigation.
Our selling and administrative expense rates were 24.4% for 2010 and 24.2% for 2009. The increase in our
selling and administrative expense rate is primarily the result of lower expense leverage given lower overall
sales.
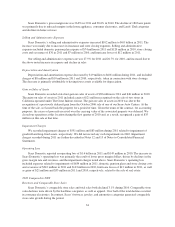
Depreciation and Amortization
Depreciation and amortization expense decreased by $25 million during 2010 to $869 million and included
charges of $10 million and $12 million in 2010 and 2009, respectively, taken in connection with store closings.
The decrease is primarily attributable to having fewer assets available for depreciation.
Gain on Sales of Assets
We recorded a gain on the sales of assets of $67 million during 2010 and $74 million in 2009. Gain on sales
of assets for 2010 and 2009 were impacted by the recognition of previously deferred gains on sales of assets.
29