Sears 2011 Annual Report Download - page 105
Download and view the complete annual report
Please find page 105 of the 2011 Sears annual report below. You can navigate through the pages in the report by either clicking on the pages listed below, or by using the keyword search tool below to find specific information within the annual report.-
 1
1 -
2
-
3
-
4
-
5
-
6
-
7
-
8
-
9
-
10
-
11
-
12
-
13
-
14
-
15
-
16
-
17
-
18
-
19
-
20
-
21
-
22
-
23
-
24
-
25
-
26
-
27
-
28
-
29
-
30
-
31
-
32
-
33
-
34
-
35
-
36
-
37
-
38
-
39
-
40
-
41
-
42
-
43
-
44
-
45
-
46
-
47
-
48
-
49
-
50
-
51
-
52
-
53
-
54
-
55
-
56
-
57
-
58
-
59
-
60
-
61
-
62
-
63
-
64
-
65
-
66
-
67
-
68
-
69
-
70
-
71
-
72
-
73
-
74
-
75
-
76
-
77
-
78
-
79
-
80
-
81
-
82
-
83
-
84
-
85
-
86
-
87
-
88
-
89
-
90
-
91
-
92
-
93
-
94
-
 95
95 -
 96
96 -
 97
97 -
 98
98 -
 99
99 -
 100
100 -
 101
101 -
 102
102 -
 103
103 -
 104
104 -
 105
105 -
 106
106 -
 107
107 -
 108
108 -
 109
109 -
 110
110 -
 111
111 -
 112
112 -
 113
113 -
 114
114 -
 115
115 -
116
-
117
-
118
-
119
-
120
-
121
-
122
 |
 |

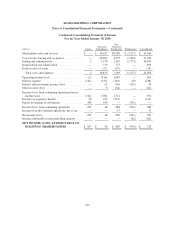
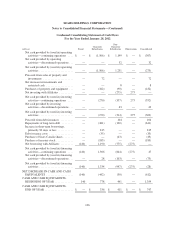
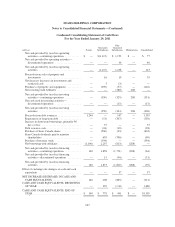
SEARS HOLDINGS CORPORATION
Notes to Consolidated Financial Statements—(Continued)
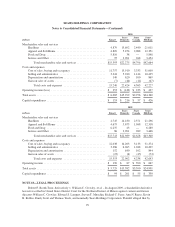
Condensed Consolidating Statement of Income
For the Year Ended January 30, 2010
millions Parent
Guarantor
Subsidiaries
Non-
Guarantor
Subsidiaries Eliminations Consolidated
Merchandise sales and services ................ $ — $ 38,457 $8,280 $ (3,377) $ 43,360
Cost of sales, buying and occupancy ............ — 28,403 4,575 (1,604) 31,374
Selling and administrative .................... 2 9,778 2,492 (1,773) 10,499
Depreciation and amortization ................. — 719 175 — 894
Gain on sales of assets ....................... — (27) (47) — (74)
Total costs and expenses ................... 2 38,873 7,195 (3,377) 42,693
Operating income (loss) ...................... (2) (416) 1,085 — 667
Interest expense ............................ (142) (415) (110) 419 (248)
Interest and investment income (loss) ........... — 42 410 (419) 33
Other income (loss) ......................... — 3 (64) — (61)
Income (loss) from continuing operations before
income taxes ............................. (144) (786) 1,321 — 391
Income tax (expense) benefit .................. 50 292 (453) — (111)
Equity in earnings in subsidiaries .............. 391 540 — (931) —
Income (loss) from continuing operations ........ 297 46 868 (931) 280
Income from discontinued operations, net of tax . . . — — 17 — 17
Net income (loss) ........................... 297 46 885 (931) 297
Income attributable to noncontrolling interests .... — — — (62) (62)
NET INCOME (LOSS) ATTRIBUTABLE TO
HOLDINGS’ SHAREHOLDERS ........... $ 297 $ 46 $ 885 $ (993) $ 235
105