Sears 2011 Annual Report Download - page 39
Download and view the complete annual report
Please find page 39 of the 2011 Sears annual report below. You can navigate through the pages in the report by either clicking on the pages listed below, or by using the keyword search tool below to find specific information within the annual report.-
 1
1 -
2
-
3
-
4
-
5
-
6
-
7
-
8
-
9
-
10
-
11
-
12
-
13
-
14
-
15
-
16
-
17
-
18
-
19
-
20
-
21
-
22
-
23
-
24
-
25
-
26
-
27
-
28
-
 29
29 -
 30
30 -
 31
31 -
 32
32 -
 33
33 -
 34
34 -
 35
35 -
 36
36 -
 37
37 -
 38
38 -
 39
39 -
 40
40 -
 41
41 -
 42
42 -
 43
43 -
 44
44 -
 45
45 -
 46
46 -
 47
47 -
 48
48 -
 49
49 -
50
-
51
-
52
-
53
-
54
-
55
-
56
-
57
-
58
-
59
-
60
-
61
-
62
-
63
-
64
-
65
-
66
-
67
-
68
-
69
-
70
-
71
-
72
-
73
-
74
-
75
-
76
-
77
-
78
-
79
-
80
-
81
-
82
-
83
-
84
-
85
-
86
-
87
-
88
-
89
-
90
-
91
-
92
-
93
-
94
-
95
-
96
-
97
-
98
-
99
-
100
-
101
-
102
-
103
-
104
-
105
-
106
-
107
-
108
-
109
-
110
-
111
-
112
-
113
-
114
-
115
-
116
-
117
-
118
-
119
-
120
-
121
-
122
 |
 |
have repurchased approximately $6.0 billion of our common shares since the Merger and may continue to
repurchase shares subject to market conditions and board authorization. In addition, we may pursue investments
in the form of acquisitions, joint ventures and partnerships where we believe appropriate returns can be obtained.
Our Board of Directors has delegated authority to direct investment of our surplus cash to our Chairman,
Edward S. Lampert, subject to various limitations that have been or may be from time to time adopted by the
Board of Directors and/or Finance Committee of the Board of Directors.
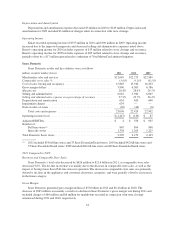
Operating Activities and Cash Flows
Holdings used $307 million of cash in its continuing operations during 2011 and generated $77 million of
cash in its continuing operations in 2010. Our primary source of operating cash flows is the sale of goods and
services to customers, while the primary use of cash in operations is the purchase of merchandise inventories. We
used more cash in operations in 2011 compared to 2010 mainly as result of our net loss in 2011 and an increase
in contributions to our pension and postretirement benefit plans, partially offset by a decrease in other working
capital needs.
Holdings generated $77 million in cash flows from continuing operation during 2010 and $1.5 billion in
2009. The decrease in operating cash flows in 2010 was mainly the result of higher working capital balances,
increased pension and postretirement contributions, as well as decreased net income.
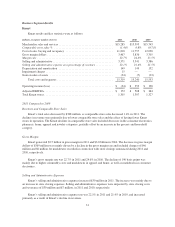
Merchandise inventories were $8.4 billion at January 28, 2012 and $9.0 billion at January 29, 2011.
Merchandise payables were $2.9 billion at January 28, 2012 and $3.0 billion at January 29, 2011. Our domestic
inventory balances decreased by $421 million to $7.7 billion at January 29, 2011. The decrease was primarily at
Sears Domestic and was due to decreases in the tools and paint, consumer electronics, sporting goods and home
categories, partially offset by increased apparel inventory at both Lands’ End and Sears. Sears Canada’s
inventory levels decreased by approximately $123 million from January 29, 2011 to $745 million at January 28,
2012 primarily due to clearing inventory due to an enhanced focus on improving inventory productivity.
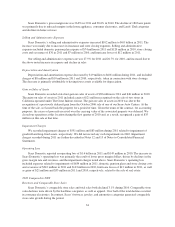
Investing Activities and Cash Flows
Net cash flows used in investing activities from continuing operations totaled $352 million in 2011,
$391 million in 2010, and $161 million in 2009. Cash used in investing activities in all three years was primarily
used for purchases of property and equipment.
We spent $432 million on capital expenditures during 2011, $426 million during 2010 and $350 million
during 2009. Capital expenditures during 2011 included investments in online initiatives, information technology
infrastructure, in-home consultative sales technology, and maintenance for stores and distribution centers. Capital
expenditures during 2010 included investments in online initiatives, information technology and infrastructure
for stores and distribution centers. Capital expenditures during 2009 included investments in information
technology and infrastructure for the stores and distribution centers.
We anticipate 2012 capital expenditure levels to be slightly below 2011 levels with continued investment in
information technology upgrades and the infrastructure of our facilities. It should be noted that in the normal
course of business, we consider opportunities to purchase leased operating properties, as well as offers to sell
owned, or assign leased, operating and non-operating properties. These transactions may, individually or in the
aggregate, result in material proceeds or outlays of cash and cause our capital expenditure levels to vary from
period to period. In addition, we review leases that will expire in the short term in order to determine the
appropriate action to take with respect to them. During 2011, we purchased 5 previously leased operating
properties for $17 million. We did not make any such purchases in 2010 or 2009.
During 2009, we received $166 million in cash from changes in investments and restricted cash. This
reflects cash received from The Reserve Primary Fund of $38 million, as well as changes in restricted cash
requirements at Sears Canada.
39