Sears 2010 Annual Report Download - page 99
Download and view the complete annual report
Please find page 99 of the 2010 Sears annual report below. You can navigate through the pages in the report by either clicking on the pages listed below, or by using the keyword search tool below to find specific information within the annual report.-
 1
1 -
2
-
3
-
4
-
5
-
6
-
7
-
8
-
9
-
10
-
11
-
12
-
13
-
14
-
15
-
16
-
17
-
18
-
19
-
20
-
21
-
22
-
23
-
24
-
25
-
26
-
27
-
28
-
29
-
30
-
31
-
32
-
33
-
34
-
35
-
36
-
37
-
38
-
39
-
40
-
41
-
42
-
43
-
44
-
45
-
46
-
47
-
48
-
49
-
50
-
51
-
52
-
53
-
54
-
55
-
56
-
57
-
58
-
59
-
60
-
61
-
62
-
63
-
64
-
65
-
66
-
67
-
68
-
69
-
70
-
71
-
72
-
73
-
74
-
75
-
76
-
77
-
78
-
79
-
80
-
81
-
82
-
83
-
84
-
85
-
86
-
87
-
88
-
 89
89 -
 90
90 -
 91
91 -
 92
92 -
 93
93 -
 94
94 -
 95
95 -
 96
96 -
 97
97 -
 98
98 -
 99
99 -
 100
100 -
 101
101 -
 102
102 -
 103
103 -
 104
104 -
 105
105 -
 106
106 -
 107
107 -
 108
108 -
 109
109 -
110
-
111
-
112
 |
 |

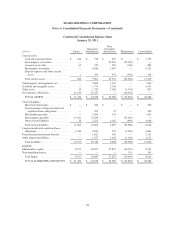
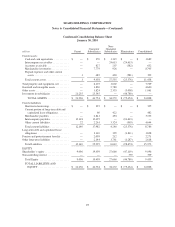
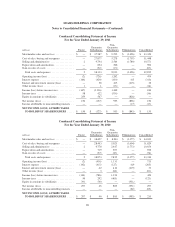
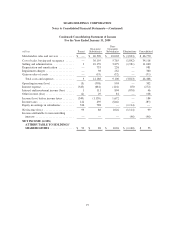
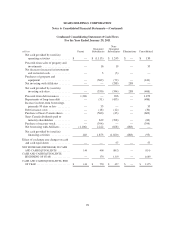
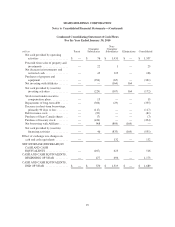
SEARS HOLDINGS CORPORATION
Notes to Consolidated Financial Statements—(Continued)
Condensed Consolidating Statement of Cash Flows
For the Year Ended January 30, 2010
millions Parent
Guarantor
Subsidiaries
Non-
Guarantor
Subsidiaries Eliminations Consolidated
Net cash provided by operating
activities .................... $ — $ 76 $ 1,431 $ — $ 1,507
Proceeds from sales of property and
investments .................. — 22 1 — 23
Net decrease in investments and
restricted cash ................ — 43 123 — 166
Purchases of property and
equipment ................... — (294) (67) — (361)
Net investing with Affiliates ....... — — (164) 164 —
Net cash provided by (used in)
investing activities ............ — (229) (107) 164 (172)
Stock issued under executive
compensation plans ............ — 13 — — 13
Repayments of long-term debt ..... — (306) (29) — (335)
Decrease in short-term borrowings,
primarily 90 days or less ........ — (117) — — (117)
Debt issuance costs .............. — (81) — — (81)
Purchase of Sears Canada shares . . . — (7) — — (7)
Purchase of treasury stock ........ — (424) — — (424)
Net borrowing with Affiliates ...... — 968 (804) (164) —
Net cash provided by (used in)
financing activities ............ — 46 (833) (164) (951)
Effect of exchange rate changes on
cash and cash equivalents ......... — — 132 — 132
NET INCREASE (DECREASE) IN
CASH AND CASH
EQUIVALENTS ................ — (107) 623 — 516
CASH AND CASH EQUIVALENTS,
BEGINNING OF YEAR ......... — 477 696 — 1,173
CASH AND CASH EQUIVALENTS,
END OF YEAR ................ $ — $ 370 $ 1,319 $ — $ 1,689
99