Sears 2010 Annual Report Download - page 92
Download and view the complete annual report
Please find page 92 of the 2010 Sears annual report below. You can navigate through the pages in the report by either clicking on the pages listed below, or by using the keyword search tool below to find specific information within the annual report.-
 1
1 -
2
-
3
-
4
-
5
-
6
-
7
-
8
-
9
-
10
-
11
-
12
-
13
-
14
-
15
-
16
-
17
-
18
-
19
-
20
-
21
-
22
-
23
-
24
-
25
-
26
-
27
-
28
-
29
-
30
-
31
-
32
-
33
-
34
-
35
-
36
-
37
-
38
-
39
-
40
-
41
-
42
-
43
-
44
-
45
-
46
-
47
-
48
-
49
-
50
-
51
-
52
-
53
-
54
-
55
-
56
-
57
-
58
-
59
-
60
-
61
-
62
-
63
-
64
-
65
-
66
-
67
-
68
-
69
-
70
-
71
-
72
-
73
-
74
-
75
-
76
-
77
-
78
-
79
-
80
-
81
-
 82
82 -
 83
83 -
 84
84 -
 85
85 -
 86
86 -
 87
87 -
 88
88 -
 89
89 -
 90
90 -
 91
91 -
 92
92 -
 93
93 -
 94
94 -
 95
95 -
 96
96 -
 97
97 -
 98
98 -
 99
99 -
 100
100 -
 101
101 -
 102
102 -
103
-
104
-
105
-
106
-
107
-
108
-
109
-
110
-
111
-
112
 |
 |

SEARS HOLDINGS CORPORATION
Notes to Consolidated Financial Statements—(Continued)
Because litigation outcomes are inherently unpredictable, these assessments often involve a series of complex
assessments by management about future events and can rely heavily on estimates and assumptions. While the
consequences of certain unresolved proceedings are not presently determinable, an adverse outcome from certain
matters could have a material adverse effect on our earnings in any given reporting period. However, in the
opinion of our management, after consulting with legal counsel, and taking into account insurance and reserves,
the ultimate liability is not expected to have a material adverse effect on our financial position, liquidity or
capital resources.
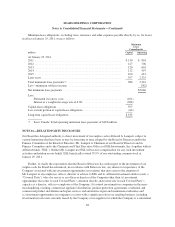
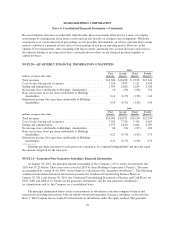
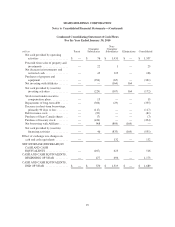
NOTE 20—QUARTERLY FINANCIAL INFORMATION (UNAUDITED)
2010
millions, except per share data
First
Quarter
Second
Quarter
Third
Quarter
Fourth
Quarter(1)
Total revenues ............................................ $10,046 $10,458 $ 9,678 $13,144
Cost of sales, buying and occupancy ........................... 7,216 7,635 7,121 9,476
Selling and administrative ................................... 2,555 2,606 2,630 2,780
Net income (loss) attributable to Holdings’ shareholders ........... 16 (39) (218) 374
Basic net income (loss) per share attributable to Holdings’
shareholders ............................................ 0.14 (0.35) (1.98) 3.43
Diluted net income (loss) per share attributable to Holdings’
shareholders ............................................ 0.14 (0.35) (1.98) 3.43
2009
millions, except per share data
First
Quarter
Second
Quarter
Third
Quarter
Fourth
Quarter(2)
Total revenues ............................................ $10,055 $10,551 $10,190 $13,247
Cost of sales, buying and occupancy ........................... 7,182 7,756 7,419 9,467
Selling and administrative ................................... 2,573 2,630 2,664 2,787
Net income (loss) attributable to Holdings’ shareholders ........... 26 (94) (127) 430
Basic net income (loss) per share attributable to Holdings’
shareholders ............................................ 0.22 (0.79) (1.09) 3.75
Diluted net income (loss) per share attributable to Holdings’
shareholders ............................................ 0.21 (0.79) (1.09) 3.74
Earnings per share amounts for each quarter are required to be computed independently and may not equal
the amount computed for the total year.
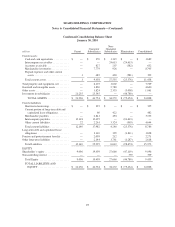
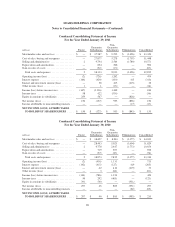
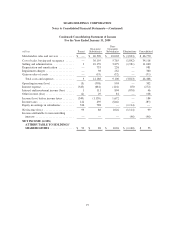
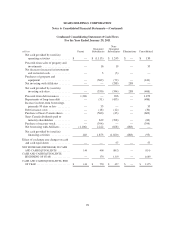
NOTE 21—Guarantor/Non-Guarantor Subsidiary Financial Information
At January 29, 2011, the principal amount outstanding of the Company’s 6
5
⁄
8
% senior secured notes due
2018 was $1.25 billion. These notes were issued in 2010 by Sears Holdings Corporation (“Parent”). The notes
are guaranteed by certain of our 100% owned domestic subsidiaries (the “guarantor subsidiaries”). The following
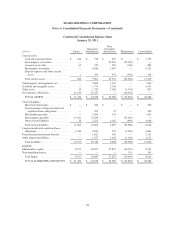
condensed consolidated financial information presents the Condensed Consolidating Balance Sheets at
January 29, 2011 and January 30, 2010, the Condensed Consolidating Statements of Income and Cash Flows for
2010, 2009 and 2008 of (i) Parent; (ii) the guarantor subsidiaries; (iii) the non-guarantor subsidiaries;
(iv) eliminations and (v) the Company on a consolidated basis.
The principal elimination entries relate to investments in subsidiaries and inter-company balances and
transactions including transactions with our wholly-owned non-guarantor insurance subsidiary as described in
Note 3. The Company has accounted for investments in subsidiaries under the equity method. The guarantor
92